The hypotheses I have to find out are the following:Boys are taller than girls The taller you are the heavier you are The more television you watch the larger the body mass index
Statistics Coursework This piece of coursework that I am doing is look at relations between height, weight, gender and Body mass index of Mayfield High School. I will do this by taking a sample of 118 out of 1183 students. The hypotheses I have to find out are the following: . Boys are taller than girls 2. The taller you are the heavier you are 3. The more television you watch the larger the body mass index. I will use the data given by my teacher and then do a stratified sample. I am doing the stratified sample so that I can get the right proportion sample for each year group. Using my calculator, I choose a random number between 1 and 10, and then go down for whatever number it is. For example, if the random number was 8 and there were 141 boys/girls in the year group I would choose the numbers 8, 18, 28, 38...38. Then I will use systematic sampling to get the right amount of people in each year group. The calculations for each year using the stratified sample are in the following: Year 7 Girls: 131 x 118 ? 13 1183 Year 7 Boys: 151 x 118 ? 15 1183 Year 8 Girls: 125 x 118 ? 12 1183 Year 8 Boys: 145 x 118 ? 15 1183 Year 9 Girls: 143 x 118 ? 14 1183 Year 9 Boys: 118 x 118 ? 12 1183 Year 10 Girls: 94 x 118 ? 9 1183 Year 10 Boys: 106 x 118 ? 11 1183 Year 11 Girls: 86 x 118 ? 9 1183 Year 11 Boys: 84 x 118 ? 8 1183 For my pilot questionnaire the
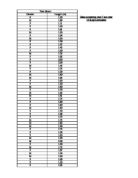
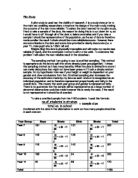
Data comparing year 7 and year 11 length estimates - How well can you estimate the length of a stick?
Year Seven Gender Length (m) F .50 M .89 F .11 F .50 F .61 M .20 F .04 M .00 F .50 F .57 F .45 F .20 M .25 F .63 F 2.00 F 2.30 M .45 F .25 F .20 M .60 M .95 F .00 F .30 M .60 F .70 M .65 M .61 F .75 F .60 F .60 M .80 F .50 F .58 F .75 M .55 M .82 M .40 F .75 F .34 F .60 M .20 M 2.50 F .40 M .73 F .67 M .24 M .30 F .09 F .50 F .05 Data comparing year 7 and year 11 length estimates How well can you estimate the length of a stick? Introduction I have collected data from year 7 and year 11 pupils and have recorded their estimates of how long they think the bamboo stick is. A bamboo stick of length 1.58m was held up in front of 173 year 7 pupils and 178 year 11 pupils. The stick was held horizontally so the length of the stick could not be compared to the height of the person. The pupils were then asked to estimate the length of the bamboo stick in metres. I have collated the data into two tables, one for year 7 and one for year 11. I have then used this data to pick a random sample of 50 from each year. I have given each set of measurements a number ranging from 1 to 173 for year 7 and 1 to 178 for year 11. In this way I will be able to use my calculator to obtain a random number, which I can use to select a set of data from my tables. I rounded the random number generated to
we can see if there is any correlation between a person's height and weight because if no correlation is present: Mayfield High School
Data handling coursework: Mayfield High School Mayfield School is a secondary school of 1183 pupils aged 11-16 years of age. For my data handling coursework, I am going to investigate a line of enquiry from the pupils' data. Some of the options include; relationship between IQ and Key Stage 3 results, comparing hair colour and eye colour, but I have chosen to investigate the relationship between height and weight. One of the main reasons being that this line of enquiry means that my data will be continuous (numerical), thus allowing me to produce a more detailed analysis rather than eye or hair colour, where I would be quite limited as to what I can do because the data is discrete. I think that this will be a more varied investigation unlike the relationship between eye colour and hair colour, as it is pretty random which colour eyes and hair you have and does not have anything in common. All the information given to us is too much to use, and therefore I have selected only a small amount of data for each student, which will be relevant to the height and weight of each student. My variables only looking at height and weight so I have deleted all the other variables besides: name, age, gender, height, weight together with method of getting to school, how far away they live from school and favourite sport since I could use all the information to extend my enquiry and could be
Compare the connection between weight and hours spent watching TV, and IQ and TV watched.
Introduction: I will be investigation several factors from the results obtained from my questionnaire asked in Dunraven High School this will be secondary data. I will also compare one hypothesis to Mayfield High School to see if I get similar results. The hypotheses I have decided to compare is the connection between weight and hours spent watching TV and IQ and TV watched. I am looking for the stronger connection between them this will be primary data Hypothesis: I am interested in investigating: * The comparison of Key Stage 2 results in Dunraven high school and to see which haven similarities with each other (more correlation between Maths and Science than Maths and English or Science and English), * If female brunettes have a higher IQ than blonde females * If the number of hours watched per week affects a person's weight. I predict that there will be a stronger correlation between maths and science than maths and English or science and English. I also predict that boys are better at Maths and Science while girls are better at English. The reason why is because I have noticed this over the years, and would like to explore these factors to prove my point. I think that female brunettes are not necessarily more intelligent however; I do believe that the lower quartile of brunettes IQ will be greater than the lower quartile of blondes. I think that the heaviest person
Statistics GCSE Coursework. Height and weight of pupils. The sampling method I am going to use is stratified sampling. This method is appropriate as the data is split into strata already (year group/gender)
Pilot Study Year Group Boys Strata Girls Strata Total Year 7 51 =13 31 =11 282 Year 8 45 =12 25 =11 270 Year 9 18 =10 43 =12 261 Year 10 06 =9 94 =8 200 Year 11 84 =7 86 =7 70 Total 183 A pilot study is used test the viability of research. It is a study done prior to the main test enabling researchers to improve the design of the main study making the outcome of the test more reliable. To select the data I wanted for my pilot study, I had to take a sample of the data, the reason for doing this is to cut down time, as I would have to sift through all of the data to delete anomalies and if you take a sample it should be representative of the population, as the set of data is therefore made smaller the result I obtain should be more reliable/accurate. However there are some blanks in the data and some data provided is clearly inaccurate (i.e. a year 11, male pupil who is 1.69m tall and Weighs 5kg) this data is physically impossible and will make my results less reliable (if used), and the conclusion I come to will not be valid. To overcome this problem I will select the next reliable result in the datasheet. The sampling method I am going to use is stratified sampling. This method is appropriate as the data is split into strata already (year group/gender) I chose this sampling method as it has many benefits; When the data is divided into
maths statistics coursework
Mathematics Statistics Coursework Aim My aim for this project, is to conduct a statistical investigation. I will form some hypotheses and try me to prove or disapprove with them. For my project, I have been asked to select data about pupils height and weight to see if there was a relationship between the two. This will then help to develop some lines of enquiry for the statistical investigation. I will randomly stratify my samples throughout the investigation. I will then, present my investigation clearly, using scatter graphs, histograms, box-plots and cumulative frequency diagrams. diagrams to help me guide the reader through the process of investigating the data and concluding with the final hypothesis. Introduction I am going to use a variety of statistical methods to analyse data, to compare the relationship between weight and height of children from year 7 to year 11. To help me with my investigation, I have received data from the Mayfield High School. The data consists of 1889 pupils from Year 7 up to year 11. I have decided to take a sample of 20% from each year group as it is a size which is manageable, yet is large enough to provide accurate data that represents the entire population. The sampling of the data is very important, when looking at such a large amount of the data. It makes the investigation easier and more enjoyable. There are many
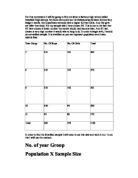
For this coursework I will be going to find out about a factious high school called Mayfield High School.
For this coursework I will be going to find out about a factious high school called Mayfield High School. My lines of enquiry are the Relationship between IQ and Key Stage 2 results. My Hypothesis are boys have a higher IQ than Girls. And that girls are taller than boys. For my sample size I have chosen 84. This is due to the fact that if I have chosen a lower number the results would may become bias. And if I had chosen a very high number it would take to long to do. In order to begin with, I would do a stratified sample. It is stratified so you can represent population and it also awards bias.coab abr seababw orab abk inab foab ab. Year Groupcoec ecr seececw orec eck inec foec ec. No. Of Boys dnHXIk0 Visit coursework ae in ae fo ae for ae more cours ae Do ae not ae redistribute dnHXIk0 No. Of Girls ZGwzED from ZGwzED coursewrok ZGwzED work ZGwzED info ZGwzED Total This dissertation from www.studentcentral.co.uk 7coec ecr seececw orec eck inec foec ec: 51cocd cdr secdcdw orcd cdk incd focd cd; 31 This cours from www.studentcentral.co.uk 282 channyman69, please do not redistribute this cours. We work very hard to create this website, and we trust our visitors to respect it for the good of other students. Please, do not circulate this cours elsewhere on the internet. Anybody found doing so will be permanently banned. 8 p9y0ln Visit coursework ga in ga fo ga for ga
Mayfield High School
GCSE Statistics Coursework Introduction: Mayfield High School is a fictional secondary school where all the students are surveyed about their body, habits, likes and dislikes. My task will be to test my hypotheses using a variety of statistical techniques and analysing my findings. The data I have been provided with is secondary data. This is data previously gathered by someone else and has been made and accessible or has been published so that it can be used by someone else. This therefore means, it is not primary data- which is data collected by the researcher (me) specifically for this project. Hypotheses: To work out a person's BMI, we take their weight in kilograms and divide it by the square of their height in metres. I travel 3km to get to school. My height is 1.65m and my weight is 65kg. Therefore, my BMI (Body Mass Index) is 24. My friend, who travels 0.5km to get to school, has a BMI of 28. This has given my hypotheses: i) Students who have to travel further to get to school will have a higher BMI compared to those who don't have to travel as far The probability of a longer journey home compared to those who live closer to school is very high. During a bus or car journey, it is likely that the student will eat snacks. When they get home, the chances are that they will watch TV, eat dinner, do homework and play on the computer. It is highly unlikely that they

Edexcel GCSE Statistics Coursework
Edexcel GCSE Statistics 1389 PLANNING SHEET - MAYFIELD HIGH Student Name: Anya Sweilam Class: 11H3 This investigation is based upon the students of Mayfield High School, a fictitious school- there are 1182 students at Mayfield presented within 13 categories. I will be investigating the relationship between height and weight and how these statistics differ between females and males. I have chosen to look at height and weight mainly because in this line of enquiry my data will be numerical and continuous, meaning that I will be able to produce a more detailed analysis. For example, if I had chosen to look at eye colour and hair colour my analysis would be limited and therefore my investigation may be imprecise. My aim in this investigation is to query whether or not there is a correlation between height and weight and find out if this varies between genders. I believe that as a student becomes taller their weight will increase; due to this assumption I expect a graph of weight and height to show a rising trend. Listed below are my hypotheses. The height and weight of a person is affected by their age and gender. I assume that in years 7-9 girls will generally be taller than boys- this is because girls tend to grow faster than boys during the early stages of development. Boys will, however, eventually grow taller and so in years 10-11 it can be
Strukturalizm
Strukturalizm, jeden z najwazniejszych kierunków nowoczesnego literaturoznawstwa w XX w., uksztaltowany po 1930. Zwiazany scisle z rozwojem metod badawczych lingwistyki strukturalnej, a takze rosyjskiej szkoly formalnej. Przeciwstawial sie metodom genetycznym w badaniach literackich. Struktualizm zostal najpelniej sformulowany w latach 30. i 40. XX w. przez tzw. praska szkole jezykoznawcza (do której nalezeli m.in. R. Jakobson, J. Mukarovský, F. Vodicka). Do glównych tez struktualizmu naleza: ) traktowanie utworu literackiego jako wypowiedzi, w której glówna role odgrywa funkcja estetyczna. 2) kazdy, najmniejszy element struktury dziela cos znaczy, a calosc jest wysoko zorganizowanym tworem semantyczno-jezykowym. 3) jezyk poetycki trzeba interpretowac w odniesieniu do systemu jezyka ogólnego i tradycji literackiej. 4) utwór literacki nalezy do zjawisk semiotycznych (semiotyka) i w tym charakterze musi byc rozwazany jako skladnik spolecznej sytuacji komunikacyjnej (twórca - odbiorca). 5) badacz literatury powinien dokonywac zarówno synchronicznego opisu struktury dziela (np. system wersyfikacyjny), jak i diachronicznego. Struktualizm rozpowszechnil sie w okresie II wojny swiatowej i po jej zakonczeniu glównie w USA (np. prace R. Welleka), a takze we Francji (m.in. R. Barthes, T. Todorov) i ZSRR (J.M. Lotman i in.). Strukturalizm, kierunek w nauce uwazany