
Height and Weight of Pupils
AO4 Coursework Mayfield High School HATCH END HIGH SCHOOL Mathematics GCSE Name: Daniel Desai Candidate number: 4073 Tutor Group: 10/18 Teacher: Mr J Quaye Date: 10/10/06 Planning Introduction In this project I will be investigating the heights and weights of pupils at Mayfield High School. Mayfield High School is not a real school, it is imaginary, and it has 1183 students altogether. The distributions of the pupils in every year are below: Year Group Number of Boys Number of Girls Total 7 51 31 282 8 45 25 270 9 18 43 261 0 06 94 200 1 84 86 70 The data I will be working with is from the Edexcel Internet Database and it is secondary data. Every student has received this data. The data is of the fictitious school called Mayfield High School. The data they have given for each pupil is their Name, Year group, IQ, Weight, Height, Hair colour, Eye colour, Distance from home to school, Usual method of travel to school, Number of brothers or sisters, Key stage 2 results in English, Mathematics and Science. I have preferred to use secondary data rather than primary data because it is more suitable; primary would take a very long time but it would be a higher degree of accuracy. The advantages of secondary data is it is easy to find and due to the short amount of time provided to complete this coursework it will be more suitable. I will not be
Reaction Times
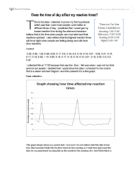
T His is the data I collected to prove my first hypothesis which was that I (and most people) work better at different times of day. I predicted that I would get my lowest reaction time during the afternoon because I believe that is the time when people are most alert and their reactions quickest. I also believe that the highest reaction times will be at night when people are feeling sleepy and will have slow reactions. Control: 0.35, 0.28, 1.03, 0.29, 0.22, 0.17, 0.2, 0.19, 0.2, 0.19, 0.16, 0.21, 0.23, 0.21, 0.18, 0.17, 0.16, 0.59, 1.16, 0.28, 0.18, 0.17, 0.18, 0.19, 0.18, 0.21, 0.18, 0.22, 0.2, 0.2, 0.45 I collected this at 17:02 because that was the time; I felt was when I was not too tired and not too awake! I decided that I would show the data I collected for the control first in a steam and leaf diagram and then present it in a line graph. Data collection This graph simply shows my control data- how ever I do not believe that this data is free from bias because it falls into the time frame for the evening so I could have just used this data for my experiment by using this as the results for the evening. So I don't think this is a very good control data but it will have to do because whatever time I choose to do results for the control, the control will be affected by that time of day. 7:00-12:00 0.21 0.43 0.26 0.24 0.38 0.03 0.34 0.1 0.22 0. 21 0.34 0.41 0.23