'Broad-sheets are more difficult to read as tabloid newspapers' discuss.
Maths Coursework: Statistics Different newspapers are written to suit different preferences. Tabloids are a lighter read whereas broad-sheets involve more 'serious' and detailed articles. My hypothesis is that broad-sheets are more difficult to read as tabloid newspapers summarise events using less profound wording, which makes articles more easily understood than broad-sheet articles. Tabloids also try to attract and hold the attention of the reader more. To see whether my hypothesis is true, I will have to compare statistically certain data between a broad-sheet newspaper and a tabloid newspaper concerning articles on similar topics and the size of certain varying texts. The difficulty of the reading can be measured by certain factors: word length, sentence length, paragraph length, article length, the time taken to read an article, area of article on page, area of headline on page etc... I have decided, for the experiment, I will compare word length- the amount of letters in a word; sentence length- the amount of words in a sentence; and percentage area of headline text that makes up the newspaper page excluding margins, pictures and other texts. I have chosen these three factors as the longer the word or sentence, the more concentration is needed to read and focus on what is being said. However, the percentage area of a headline is to prove how much of the newspaper is
Maths Coursework: Car Sales
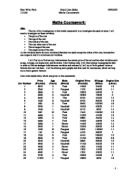
Maths Coursework: Aim: The aim of my investigation in this maths coursework is to investigate the used car sales. I will need to investigate on these variables: * The price of the cars * The age of the cars * The makes of the cars * The cost when new of the cars * The mileage of the cars * The engine sizes of the cars All the variables above are ratio variables (Numbers are used) except the makes of the cars, because that one is special and it's called nominal variables. I will first try to find out any links between the current price of the car and the other variables such as age, mileage, car engine size, and the make. After finding links, I will then attempt to progress the data in order to find out stronger links between variables and eventually I will try to find a general value or formula that can link them. I will be drawing some graphs and then look for conclusions, which can help me to find a general formula. Here is the results table, which was given in this coursework: Car Number Price (Pounds) Age (Years) Make (Brand) Original Price (Pounds) Mileage (Miles) Engine Size (Litres) 6970 3 Ford 1600 24000 .6 2 3350 7 Peugeot 7100 85000 .1 3 3995 6 Ford 3800 52000 2 4 5300 6 Vauxhall 6300 70000 2 5 6500 3 Fiat 8700 24000 .2 6 500 9 Vauxhall 8700 82000 .6 7 995 9 Ford 8500 02000 .8 8 3000 7

Effects of acid rain in germination and growth of mustard seeds
Verónica Rosinha 5IB Effects of acid rain in germination and growth of mustard seeds Research question How is the germination and growth of mustard seeds affected by exposure to acid rain? Hypothesis: By carrying this investigation I expect that acid rain will decrease the germination and growth rate of mustard seeds. The lower the pH, the more the germination and growth will be decreased. General background Acid rain is caused by the presence of SO2 and NO2 in the air, which dissolve in the water forming sulphuric acid and nitric acid. It usually has a pH value of about 5; however this value can be lower. Due to the presence of acids, the acid rain causes decreased growth in plants, whose usual effects are usually poor root growth and poor leaf development. Poor root growth can result from exposure to soil of low pH, as the shape of proteins - including enzymes - are changed. Poor leaf development might result from deterioration of the cuticle by the acidic rain. Mustard is a quick-to-mature, easy-to-grow vegetable for greens or salads. For a higher rate of growth of mustard seeds, soils with a neutral pH are required, although an alkaline pH can be tolerated "Soils with a pH neutral are desired for this crop. Nevertheless, an alkaline and slightly saline soils are tolerated" (quoted from www.hort.purdue.edu/newcrop/afcm/mustard.html). Variables: Variables to be

In this piece of coursework, I am going to evaluate and try to find the difference in readability between the three types of newspapers on the market in the UK. These types are: Broadsheet, Quality and Tabloid.
GCSE Maths Coursework - Higher Level By Zachary Bishti .AIMS: In this piece of coursework, I am going to evaluate and try to find the difference in readability between the three types of newspapers on the market in the UK. These types are: Broadsheet, Quality and Tabloid. As mentioned above the three types of newspaper existing on the market in the UK could be generally classified as either Broadsheet, Quality or Tabloid. Examples of these types of paper are: Broad Sheet: * The Times * The Guardian * The Telegraph Quality: * Daily Mail Tabloid: * The Sun * News Of The World * The Mirror * Star From my initial impressions, I can see purely from reading the articles that there is a substantial amount of difference in the intelligence in the reporting level and journalism style in each paper. These differences in content easily gives away the "Type classification" of the newspaper. I think that Broadsheets are more intellectually oriented and political. The reason for this is that this type of newspaper is targeted towards a specific audience who are mature persons, both in age and in political views. Professional, Managerial, and University students are also targeted readership. I think that Broadsheets are generally read because they deal with current issues in a more thorough manner, but they may also include social stories that are well written and
Regional distribution centre report.
Regional Distribution Centre Report Introduction: My company that I work for is currently expanding and has recently opened several new superstores on the outskirts of large urban areas. The existing distribution centers, which supply stores, are finding it difficult to meet the increased demand. So, the company has decided to set up a new distribution centre in an area, which has a mixture of old supermarkets and new superstores. Mileage: Mileage is one of the most important factors on this survey and research that I am doing and Prime thing that I have to look for is how far it is from the motorways and the supermarkets. In my opinion location C has got the best mileage and the one with the least mileage is D. Accessibility: Accessibility is not as important as mileage but it is still a convenient factor of the research and has to be considered very deeply. If the place has plenty of doors and garages, then it would be more convenient than a store with less doors and garages for the trucks or lorries to take our stock to the superstore. The best one again is location C and the worst one again is location D. But we have to remember that some locations are better at other things than at some things. Suitable Land: Land is vital for the company because we need lots of space for our staff to store the products from our regional distribution centre.6 acres would be good

GCSE Maths Bad Tomato Investigation
GCSE Maths Bad Tomato Investigation GCSE Maths Bad Tomato Investigation A problem has emerged involving bad tomatoes. I am going to investigate it and find some solutions to the problem. At first there is a regular tray of good tomatoes. Then suddenly, one goes bad. An hour later, all the ones that the bad tomato is touching go bad. This continues until the whole tray goes bad. The problem gets worse when the trays are stacked on top of each other, but I'll look at that later. I'm going to start by investigating a normal square box of tomatoes. It would look like this to start with: Then let's say tomato 1 goes bad: After one hour, tomatoes 1, 2 and 5 will be bad: Then after another hour tomatoes 3, 6 and 9 will go bad. This will continue until the whole tray of tomatoes is bad: After looking at this process, a pattern became obvious. This was that the quickest legal route to the furthest tomato away from the original bad tomato would be the number of hours for the whole tray to go bad. Basically, if tomato X goes bad, then the quickest legal route to tomato Y, being the furthest tomato away from tomato X would be the number of hours for the whole tray to go bad. Let's call this the XY rule. This 4 tomato by 4 tomato tray would take 6 hours to go bad: The order of tomatoes going bad is illustrated in this table: Hour (H) No. of bad toms after that hour

The Language of sports reports, a comparative approach between tabloid and broadsheets.
Introduction This project is based on relating to the difference between a particular sports report portrayed in both the tabloid and broadsheet newspapers. The report is a football report focusing on one match in particular. - Manchester United versus Maccabi Hyfa. This project will be focusing on the stylistic differences evident in the two reports. The subject of the report is football. However this is of little importance as it is the difference between the tabloid and broadsheet newspapers I am looking for. With particular reference to the stylistic features evident. Features such lexis choice, (i.e. words with a high amount of syllables) compound/complex sentences, (with reference to sub clauses etc. - which is a good feature when proving the difference in technicality between the two articles.) discourse structure, graphology (i.e. image choice/what the image portrays etc.) and semantics are all looked at. Also, a number of frame works will be looked at, with the intention of seeing if the styles of the two newspapers differ more. The frameworks that will be looked at include: The Register, Discourse structure, Lexis, Grammar, Syntax, Graphology, (Pragmatics), Semantics, Metaphorical language and typographical features. Stylistic features will also be looked at will particular reference to features such as alliteration and Metaphors. The proportion of
How Business Works
GNVQ How Business Works For task one of my How Business Works assignment I am going to take the car manufacture Ford. For task one I will have to discuss and explain the history, aim, objectives and activities of Ford. * 1903 and the car manufacture Henry Ford Incorporated was established this company is now known as Ford they sold their first car a Model A to a dentist in Chicago. * 1908 Henry Ford introduces the Model T which was very popular. * 1913 the company began to trade overseas and Ford invented the assembly. The assembly which is used everywhere today. * 1922 the company is now doing extremely well and the Ford Company decides to buy Lincoln Motor Company. * In 1942 Henry Ford halts the out put of civilian cars because of world war two and shifts to military production. * 1947 and Henry Ford dies in his estate in Michigan but the company does not die with him but develops into one of the worlds largest car manufactures and operates globally. Ford also now developed or has taken over (Lincoln, Mercury, Mazda, Volvo, Jaguar, land rover and Aston martin.) Fords Aims With ford there would be a wide range of aims these aims would vary from benefiting the company to benefiting to shareholders and to reliability of there cars I am now going to list and explain some of these aims One of Ford biggest aims would obviously be to make a profit that was bigger

Tabloid and broadsheet newspaper comparison maths coursework
Maths Coursework Michael Grainger S1 Task D: Authorship Introduction: Tabloid and broadsheet newspapers are both aimed at different audiences. This, therefore, means that they are written differently to correspond with the audience that they are aimed at. Tabloid newspapers supposedly give an easier read than a broadsheet newspaper and this is what this investigation will prove. Aim: The aim of this piece of coursework is to gain information about authorship of a text using statistical measures. I will collect data from a population with a view to estimating population parameters (e.g. mean & variance) by using estimation techniques from the previous module. The task will involve taking a random sample, expressing my results in various forms appropriate to the work also calculating and comparing confidence intervals. Prediction: I predict that after counting the letters in sample words from both a tabloid and a broadsheet newspaper, that I will find that the broadsheet newspaper has longer words overall because it is aimed at a more educated audience. This then means that the tabloid will have a shorter mean word length making it an easier read for the audience that it is aimed at. The population being used is a random sample of word lengths from both a tabloid newspaper and a broadsheet newspaper. When

I will research the cars by putting the data I have been given into statistical charts, graphs and tables to analyse them. I will use a scatter graph to firstly look at how age affects all cars depreciation
Plan This piece of coursework has asked me to look at the prices of used cars and what makes their prices decrease. I think that the most important thing to do is to work out the depreciation of all of the 100 cars. I will do this first because I think that this will make the cars more easily comparable and put them all into percentage form. I will work out depreciation by using this equation. * D= C x100 O o D= Depreciation o C= Change in price o O= Original price This is the equation to work out the depreciation of a car. I will research the cars by putting the data I have been given into statistical charts, graphs and tables to analyse them. I will use a scatter graph to firstly look at how age affects all cars depreciation. This will have either a line or curve of best fit. If it is a straight line I can work out the equation of the line. The equation for this is: * Y=M><+C o Y= Depreciation o M= The gradient of the line o ><= Age o C= Where the line intercepts the y-axis This means I can approximately calculate the age of any car from only the depreciation and vice-versa. From the line I can also create a box plot and read the lower and upper quartiles, the inter quartile range, the median and the range. On this graph the lower quartile would show that a car loses a quarter of its value in however many years, the upper would show that the car