Height and Weight of Pupils
AO4 Coursework Mayfield High School HATCH END HIGH SCHOOL Mathematics GCSE Name: Daniel Desai Candidate number: 4073 Tutor Group: 10/18 Teacher: Mr J Quaye Date: 10/10/06 Planning Introduction In this project I will be investigating the heights and weights of pupils at Mayfield High School. Mayfield High School is not a real school, it is imaginary, and it has 1183 students altogether. The distributions of the pupils in every year are below: Year Group Number of Boys Number of Girls Total 7 51 31 282 8 45 25 270 9 18 43 261 0 06 94 200 1 84 86 70 The data I will be working with is from the Edexcel Internet Database and it is secondary data. Every student has received this data. The data is of the fictitious school called Mayfield High School. The data they have given for each pupil is their Name, Year group, IQ, Weight, Height, Hair colour, Eye colour, Distance from home to school, Usual method of travel to school, Number of brothers or sisters, Key stage 2 results in English, Mathematics and Science. I have preferred to use secondary data rather than primary data because it is more suitable; primary would take a very long time but it would be a higher degree of accuracy. The advantages of secondary data is it is easy to find and due to the short amount of time provided to complete this coursework it will be more suitable. I will not be
Reaction Times
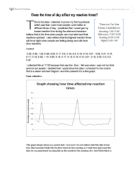
T His is the data I collected to prove my first hypothesis which was that I (and most people) work better at different times of day. I predicted that I would get my lowest reaction time during the afternoon because I believe that is the time when people are most alert and their reactions quickest. I also believe that the highest reaction times will be at night when people are feeling sleepy and will have slow reactions. Control: 0.35, 0.28, 1.03, 0.29, 0.22, 0.17, 0.2, 0.19, 0.2, 0.19, 0.16, 0.21, 0.23, 0.21, 0.18, 0.17, 0.16, 0.59, 1.16, 0.28, 0.18, 0.17, 0.18, 0.19, 0.18, 0.21, 0.18, 0.22, 0.2, 0.2, 0.45 I collected this at 17:02 because that was the time; I felt was when I was not too tired and not too awake! I decided that I would show the data I collected for the control first in a steam and leaf diagram and then present it in a line graph. Data collection This graph simply shows my control data- how ever I do not believe that this data is free from bias because it falls into the time frame for the evening so I could have just used this data for my experiment by using this as the results for the evening. So I don't think this is a very good control data but it will have to do because whatever time I choose to do results for the control, the control will be affected by that time of day. 7:00-12:00 0.21 0.43 0.26 0.24 0.38 0.03 0.34 0.1 0.22 0. 21 0.34 0.41 0.23

I chose to do my coursework on investigating different aspects of different newspapers.
Maths coursework I chose to do my coursework on investigating different aspects of different newspapers. I have several newspapers at home because my dad, granddad and grandma read different newspapers, since I want to start reading and do not know which one to choose, I am going to investigate which newspaper would be suitable for me by investigating the following factors. . which newspaper have more adverts 2. which newspaper tend to use pictures to express its idea more than using words 3. the readability of each newspaper 4. which newspaper will have more articles on sport, or more articles on business etc. I did a questionnaire before I actually did my investigation and I noticed that the tabloids newspaper is more popular. I think this is because it tends to use a more exaggerate approach when reporting articles, using big, informational pictures on it's front page to attract readers to buy it. I would expect the broadsheet newspaper or the quality to have the most readability because most of the readers of this paper are more elderly and would prefer reading than just looking at pictures. The tabloids should have more articles on sport than on business because they again use big pictures and a short paragraph to report a sport result while a quality or broadsheet newspaper would just use a normal sized picture with a long paragraph. Also, during the questionnaire,

I chose to research the effects of social facilitation because I've always wondered how and why the presence of people can affect your performance when carrying out tasks especially in the area of sports.
Background I chose to research the effects of social facilitation because I've always wondered how and why the presence of people can affect your performance when carrying out tasks especially in the area of sports. Social facilitation is a term used for the presence of others can increase arousal and therefore enhance dominant responses. Previous Research Floyd Allport, Participants were asked to write down as many associations as they could think of for words printed on the top of an otherwise blank piece of paper, (e.g. "building", ""laboratory") They were allowed to work for three one minute periods and performed alone and in front of two other persons. Results were quite clear : 93% of the participants produced more associations when working in the presence of others than working alone. Zajonc's drive theory of social facilitation. As we have seen the presence of others, especially when they are paying close attention to out performance as an interested audience, does seem to increase the feelings of arousal. Zajonc put forward a theory to explain this: First the arousal increases dominant responses. Second is the response can either be correct or incorrect. Also if it is found that the people are skilled in the task they will perform better than people less skilled. In his study people were asked to pronounce words between one and sixteen times, some of the words
Newspaper Comparisons
Adam Deas Newspaper Comparisons GCSE Maths Statistics Assignment For Newspaper Comparisons Statistics Project The data I collected I found in the Times, Daily Star and the Observer. I chose these newspapers because they are all completely different types of papers, for example the article in The Times is twice as long as the article in the Daily Star. With the similar articles from the different newspapers I am going to count up how many: * Paragraphs * Lines * Words * Characters * Characters (with spaces) Once I have established all of my data I will start to compare and contrast my results. I will construct these results in a series of pie charts, graphs and tables. The Category I have chosen to target is about Terrorism. I have decided to refine my category to the, Charging Over Tube Terror Plot. The three papers I have chosen have the same title within a couple of words of each other. I have chosen three papers so that I can produce a wider range of results in my assignment; I also create a better average in my statistics. The categories I have chosen are in all three of my papers with the same articles, this is why I chose these papers plus the articles are an adequate size for what I need. The articles are of a size to gain all of my information needed to carry out my assignment to its full potential. Measurement of space was not helpful as some
Investigation into the effects of levels of processing.
AQA PSYCHOLOGY PROJECT BRIEF PROPOSAL FORM Candidate Name: Noreen Mahmud Centre Name: Allerton High School Centre Number: 37631 Title of work: Levels of Processing PB1: Identify the aim of the research and state the experimental/alternative hypothesis/es. (credited in the report mark scheme) To show how different levels of processing affects the memory. "People who process information deeply (i.e. semantic processing) tend to remember more than those who process information shallowly (i.e. visual processing)." PB2: Explain why a directional or non-directional experimental/alternative hypothesis/es has been selected. (I mark) I have used a directional experimental hypothesis because past research, such as that by Craik and Tulving (1975) has proved this. PB3: Identify the chosen research method (experimental, survey, observation or correlational research) and if appropriate, the design used. (1 mark) I am using a lab experiment as my research method. I am using an independent groups design. PB4: Identify the advantages(s) and disadvantage(s) of the chosen research method. (2 marks) The activity is artificial. However, the findings can be used to help improve the memory. The study is well controlled, so it is unlikely that there are any other factors affecting the findings. However, some participants may guess the aim, and may either try to
New Words
New Words New words are being added to the English language at any different time. New words can be entered for many different reasons. However, it is generally due to the changes in technology and the changes to everyday society. For example, when the technology levels increased do that the computer was developed, the word computer was then invented and added to the English language to fit this change. Throughout this essay I am going to be looking at 8 new words that have been introduced into the English language within the last 50 years. STONED. Entered into the dictionary in 1952. This means to be under the influence of drugs or alcohol. It was first heard in the 1940's where it was used among US jazz musicians. Then it was used to express that someone was under the influence of drink, drugs or euphoria. As is became more commonly used it was used to express that someone was simply under the influence of drink or drugs. As time progressed, the 1960's mainly used it for those under the influence of cannabis. 'Stoned' comes under the form class of an adjective as it is describing the way that a person would be after alcohol or drugs. It is however slang term. "He is stoned". This is one of most common way that the word is used. In this case it means that the male in question has either been drinking alcohol or taking drugs (although in this day and age it

Maths Coursework
Maths Data Handling Coursework: Aim: For this investigation, I am going to select 4 different newspapers, and compare them. I will represent data collection in a number of appropriate forms. I will analyse the content and style of each newspaper and make comparisons between them. I will analyse such things as the content, amount of space devoted to particular items, readability and the size and number of pages. Hypothesis: Different types of newspapers will produce different data and for this reason I selected a range of newspapers. I predict that the broadsheets newspapers will be more detailed; I would expect they will have a greater number of words and the content would be more informative and focused on current affairs. In tabloid newspapers I would expect the content to be less informative and the readability in terms of language to be easier. There would be a visual difference between the types of newspapers in the headlines, fonts and number and type of pictures. Collection Method: I am going to collect a total of four different newspapers: - The Daily Telegraph - The Times - The Sun - The Metro To gather a wide range of results, I will collect 4 different versions of each newspaper. From this data I will be able to compare the newspapers with each other and analyse them. Name of Paper Type of Paper The Daily Telegraph Broadsheet The Sun Tabloid The
The aim of this investigation is to find out what influences the price of used cars (second hand). Used cars usually cost less than brand new cars, but this can be affected by hypotheses' such as mileage, age, colour, how it has been used etc.
Cherry Robinson 10/79 01/05/2007 Maths Coursework: Strand one: Aim: The aim of this investigation is to find out what influences the price of used cars (second hand). Used cars usually cost less than brand new cars, but this can be affected by hypotheses' such as mileage, age, colour, how it has been used etc. My investigation is to find out how these hypotheses affect a used cars' price. Hypotheses: For my example I have chosen to use the hypotheses: 1: age, 2: mileage, 3: weather it was expensive when new and 4: make. I have chosen these because I think they are most likely to affect the price of used cars. Sample: Out of my database of 150 I need to randomly select at least 30 samples. Samples are used representatively. They represent the whole database. We use samples because it would take too long to investigate every piece of data on the database, so we only investigate the samples. This is acceptable because they are selected randomly. The samples are very poor because there was a database of 150 and only 30 samples. The probability of getting a common car (i.e. Ford) is higher than less common cars (i.e. Mercedes) Testing hypotheses one. I'd expect to find negative correlation. But vintage cars might be worth more as they get older. Good condition old cars might be worth more when older. New cars that are written off might be worth less than others of
A comparison of literary styles in two newspapers.
Literary Styles: A comparison of literary styles in two newspapers. Julia Hodgson Maths Division 1 November 2001 Introduction I have chosen to compare two national newspapers. The Times is an older, more historical and hopefully more traditional newspaper. The Independent is newer, more modern and up to date. Research on the Internet has shown that The Times sells more copies than The Independent, but The Times reader has an average age of 49 whilst the Independent is bought by slightly younger people on average 40. This information shows that although they aim for similar target audiences, they each represent a different section of this market. The data will be collected from these two newspapers that are printed on the same day and are on the same topic. Newspaper A: The Times, October 30th 2001, New York Prayer Service. Newspaper B: The Independent, October 30th 2001, New York Prayer Service. The aim of this Coursework is to obtain data from each article that will help provide a conclusion to several hypotheses. Each hypothesis will have several objectives to be completed before a conclusion will be drawn. Hypotheses . 'The Times will have more syllables per word than The Independent' Objectives Choose a sampling method to allow fair and random data to be measured. Count the number of syllables in each selected word and record the