The papers will both be from the same day in case something happens on one day and nothing happens on another.
I will use median, Lower Quartile (LQ), Upper Quartile (UQ) and Inter-Quartile Range (IQR) so that I can give a gauge of the area in which most letters or words appears e.g. 4 to 7 words or 3 to 6 letters. I will show this on a Box and Whisker diagram.
I will also use Standard Deviation.
This is a sophisticated statically spread of numbers
i.e. mean + or -
X3
Mean - you have to add up all the values in a set of data and then divide that sum by the number of values in the dataset.
Median – This is the number in the very middle of a list of numbers
IQR - This is the difference between the Upper Quartile and the Lower Quartile
Standard Deviation – I am also going to work out the standard deviation of the data I have collected, as it is a good way of measuring the spread. A large measure of spread will show a higher language level, because every sentence needs small words such as "a", "it", "and", "the" and "I" to make sense, and a large measure of spread would show that there are words with a lot of letters as well. A small measure of spread would show that the word length is not varied that much, but it may mean that either the words were all mostly short, mostly long, or somewhere in-between. The formula used to find Standard Deviation is:
Readability is how easy something is to read. This is used to calculate what the reading age of an article is by determining the difficulty of the language.
This is normally shown as what age the paper is appropriate for.
I will be using the Fogg Test of Readability.
I am going to investigate the readability of two newspapers. I will be using a Stratified sample of 100 words. This should give a good overall view to the newspaper.
I will use the formula that follows to find the age the paper is for.
Analysis
By looking at the box plots for both The Times and The Mirror shows that there is a larger range from The Times. It has a range of 15 to the range of 13 from The Mirror. The median is also a lot higher. The Times has 8 compared to the 6 of The Mirror (A difference of 2 letters per word). The inter quartile range is similar though; The Times has I.Q.R of 3 compared to The Mirrors 4. The upper and lower quartiles are both higher from The Times. The Times has an upper quartile of 9 and The Mirror has 8. The lower quartile is 6 for The Times and 4 for The Mirror. This suggests that The Times has more letters on average than The Mirror, but this is only from a small section of the paper.
Box plots for both The Times and The Mirror shows a range of 13 for The Mirror and 15 for The Times. The median is the same for different, but The Mirror has a larger inter quartile range than The Times. The upper quartile range is 8 and the lower is 4 giving The Mirror an inter quartile range of 4 whereas The Times has an upper of 9 and a lower of 6 giving it an inter quartile range of 3. The upper quartile is a lot higher for The Mirror which overall means it has larger words than The Times for this section.
The cumulative frequency diagram shows The Times to have a greater frequency of letters per word. The Mirror has more medium size words than The Times.
From the results of the readability test we can see that the language used in the Times is for an older person than the language used in the daily Mirror. In the Times the language used is for people 20.1 years old, whereas the language used in the Daily Mirror is for 15.8 year olds. This means that the Times are more orientated to a person five years older than the person the Mirror is for.
Conclusion/Evaluation
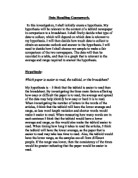
My prediction is correct. In the conclusion the results suggest that The Times has more letters per word on average than The Mirror and longer sentences, but this does not mean that this is conclusive. There is only a small sample that has been taken. If there was more time larger, wider investigations could have been taken. I could have investigated other newspapers. I could also have investigated on the size of photographs or pictures that were in the papers, to see if there was a correlation between the size and number of pictures to the size of the words. A factor for there not being enough time was that I collected the results in a group but then lost the results. So I got some old newspapers from a month ago, which were available to me and started on my own results.