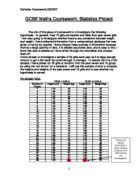
I will take my samples in a stratified form. This means that I will have the same ratio of sexes and year groups in my sampled 60 children as in the whole school of 1183 students. I will pick the students in each strata at random. To make sure that I pick them at complete random, I will use the random number feature on the calculator. This is how it is done:
1) Press the shift button.
2) Press the button with RAN# written on it.
(NB. This procedure is only guaranteed to work on Casio fx calculators)
The reason I will do this is to make sure that there is no bias in the selection of samples. If selected the samples myself then there is a chance for bias to be present. This is because I may pick the samples that will help support my prediction, or I may pick samples that a not likely to be outliers so that it would be easier for me to process the data.
Prediction
I predict that the height and weight of the students are linked. I predict this because when a person gets taller, there is more (larger volume of their body) of them, and that would probably mean that they will weigh more. I also predict that boys will weigh more than girls on average as I think boys are more built than girls. I predict that the girls will be taller than the boys in the younger year groups, but the boys will be taller in the older year groups. I predict this as girls usually have a growth spurt when they are about in year 7 or 8, while the boys have their growth spurt much later at around year 10 and will grow for a longer period of time.
Summary
After I had collected the data and stratified it, I worked out the mean height and weight for each year group and then the standard deviation from each mean. I then put the data into graphs. Firstly I made a frequency table. Secondly I used the table to make some histograms. Then I made scatter graphs, dual bar charts, pie charts and finally made cumulative curves.
The results showed that the height does have a link with the weight. It shows that when the height increases so does the weight. My prediction that the girls would be heavier and taller in the earlier years and then would become overtaken by the boys during the later years was correct.
Average Height
Average Weight
NB: THE * MEANS RECCURRING. I HAVE HAD TO USE IT INSTEAD OF THE DOT AS YOU CANNOT TYPE DOTS DIRECTLY ABOVE A CHARACTER
ON MY COMPUTER. SORRY FOR THE INCONVENIENCE.
Year 7
The boys were shorter and lighter than the girls. The girls also had a much tighter distribution in height than the boys, as their standard deviation was nearly half of the boys’. The girls also had a tighter distribution in weight than the boys but this was a minor margin in comparison with their distribution of height.
Year 8
The boys are shorter and lighter than the girls like in year 7, but surprisingly both the girls and boys in year 8 are lighter on average than their counterparts in year 7. This is likely to be down to having dodgy samples, or there be another reason. The only one I can think of is the possibility that there may have been unusual circumstances during the year of their births, or it could have been something to do with the local hospital. (I have suggested this as people going to the same school are highly likely to come form the same neighbourhood. Out the large percentage that do, most would have been born there, and most areas have only one major hospital nearby, hence most of the neighbourhood are born there.)
The girls still have a tighter distribution on weight and height but slightly looser compared to year 7.
Year 9
The boys are taller than the girls on average, unlike the younger years. But still the girls are heavier on average. The distribution for height is nearly the same as with the younger boys, but the standard distribution on weight has doubled in comparison with previous year groups. There may a good reason for this to have happened. The reason is probably because of the fact that an outlier was included in that section. He has been identified as George Jungla, and he is an outlier as his weight (90kg), is nearly double the average weight for that section. There is also a reason for the girl being shorter than the boys on average than the boys, and it is not because the boys had a growth spurt, instead it is because another outlier exists in this year group, but this time amongst the girls. She has been identified as Louise Savage. She is an outlier as she is only two thirds of the average height for that year group. And she is approximately 50cm shorter than most of the girls in her year group. This was also the reason for the standard distribution of the girls’ height to quadruple from the figures for the younger year groups.
Year 10
The boys are taller and weigh more than the girls. This time the reason can be put down to the fact that the boys have gone on a growth spurt. The boys also have a much tighter distribution of height and weight than any of the other younger year groups. For the second time the girls have become lighter than the previous year group. I think that this could be happening as (no offence to any this may apply to) it is common for girls of that age to be very conscious about their weight, and to go on diets to try and lose weight, and in many cases they lose more weight than necessary and become underweight.
Year 11
The boys are still taller and heavier, but they haven’t grown, and neither have the girls. This is the case even thought the average height and weight went down for the boys and the average height and weight has increased for the girls. This is because the changes were very subtle and are highly likely to have been caused because of individual differences. But on the overall I can say that the boys and girls probably reached their maximum height and would grow no more for the rest of their lives. I cannot however say anything about the weight as it is easily changeable unlike height.