Hypothesis 4
Mathematics involves a lot of logic, as does your IQ. Therefore, I think that pupils with Maths as their favourite subject will generally have a higher IQ. I will need to look at a sample of about 50 pupils. I will use a stratified sample to get a fair representation of each favoured subject. Then I will represent the data in various graphs and charts and then conclude whether the Mathematicians have a higher IQ.
Hypothesis 5
I think that pupils whose favourite subject is an out going subject like P.E or D.T will have a lower IQ because the pupils may not be as good at academic subjects so they enjoy the outgoing ones. I will need to again take a systematic sample from the data and study the results I get. I will also need to specify what subjects I consider to be outgoing ones.
Reliability of the Data
During this coursework I will be mainly using secondary data from the database so I cannot be certain that all of the data in the database is reliable. Some of the results in the database are quite obviously unrealistic. For example, one pupil states that they watch one million hours of TV in a week. This is physically impossible and so I decided to not just ignore this piece of data but to delete that pupil entirely from the database.
There are also other ways in which I cannot be sure if the database is reliable.
It may display some incorrect. They may have asked the pupils questions in a biased way so I cannot be sure whether the pupil answered the question fairly and therefore given incorrect information making the database unreliable.
The person who entered the data into the database may also have made some typing errors, which would also make the data in the database unreliable.
These are just some of the things that could make the database unreliable but I cannot correct the data as I do not know the source of the data. Therefore, I will just to use the data as I see it deleting only the obvious incorrect data
When I collect my own primary data I will make sure that the data that I collect is completely reliable. I will do this by asking the questions in a completely unbiased way and making sure that I enter the data into the database not making any errors. I will double check what I enter to be sure. When I get the data and someone gives me an unrealistic answer I will ask them to answer again with a more serious answer.
Collecting Data
I have already got a large amount of secondary data in the database but I also want to get primary data to compare with the secondary data. To get primary data I will visit my primary school and ask questions to some of the pupils there. It is quite a small school located in Tunbridge Wells, Kent. It is called ‘Bishop’s Down Primary School’. I have contacted the Headmistress at the school and have received permission to ask some of the pupils some questions. I have already made a visit to the school and took a sample of 10 pupils from each year group from Year 2 to Year 6. I used random number sampling to decide which ten pupils to use in my sample. I will not personally ask each pupil in the sample the questions but give them a short questionnaire to answer in 10 minutes. The headmistress has kindly asked them to fill in the questionnaire at school so when I return to the school I can just pick up the questionnaires. Before I visited the school to get the data I asked the questions that I planned to ask the pupils to 10 people in my school. This is my pilot survey to see if the questions that I asked would actually work. If they don’t then it wouldn’t have been too late to change the questions. Here are my original questions.
- What Gender are you?
Male Female
- What hand do you write with?
Right Left Both
- What is your favourite school subject?
…………………………………………………………………………………..
- To the nearest hour, how many hours of TV do you watch per week?
…………………………hour(s)
-
What did you score in the IQ test done at bin/iq_quiz/uk/Oiqnew.cgi?
…………………………………………………………………………………..
I got good feedback from the questionnaire and I didn’t need to change any of the questions in the questionnaire.
When I went to the primary school I had no problems as all of the questionnaires were filled in seriously and all were returned to me. This was useful as it meant that I could use all of the collected data. Here is a table of the results that I got from the school. I got a sample from 27 females and 23 males.
Analysing
Hypothesis 1 –
In general, the pupils with the higher IQ’s watch less TV than the pupils with a lower IQ
I need to prove that generally, the pupils with a high IQ don't watch a great deal of television. I will only compare the top 100 pupils to the rest of the school. I think that the majority of the pupils with a high IQ will watch less than 10 hours of TV per week and only a few will watch more than 20 hours of TV per week.
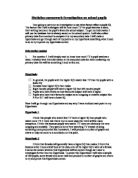
The first thing I decided to do was create a pie chart of how much TV the higher IQ students watch a week and compare it to a random sample of the whole school and how much they watch a week. Here is the pie chart showing how much TV the pupils with a high IQ watch a week.
I used random number sampling on the whole school to determine what 100 pupils I would compare this pie chart to. Here is the ID numbers of the 100 pupils that came up in the random sample:
Here is the pie chart showing how much TV they watch per week.
I am now going to look at my primary data and see whether the results are similar to the secondary data. I will take the 15 pupils with the highest IQ and compare the amount of hours they watch TV per week with how much a random sample of 15 from the data watch TV. Here are the top 15 pupils from ‘Bishops Down’ in terms of IQ.
Here is the random sample of 15 from ‘Bishops Down’.
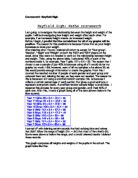
Here are the two pie charts showing how much TV pupils in Bishops Down Primary School watch per week. Each pie chart was based on a sample of 15.
In both pie charts I have moved the sections that I believe represent the people who watch too much TV. As you can see, there are more people who watch a lot of TV with a lower IQ. You can also see that the portion of people with a higher IQ that watch 10 hours or less is over double the amount than that of the random sample of the entire school.
Here are two tables showing the cumulative frequency of the number of hours of TV watched per week by the pupils with a high IQ and by the sample of 100 from the entire school.
Below: The amount of TV watched by pupils with a high IQ per week. Sample of 100.
Below: The amount of TV watched per week by pupils in the school. Sample of 100.