From this data I am now going to draw two scatter graphs, one for boys height and weight and one for girls height and weight and compare them by looking at the correlation. (graphs drawn on graph paper.)
Looking at the boys graph, you can see that all the points are beyond the weight of 35kg and are high up on the graph which shows that as the boys are getting heavier they are getting taller. There is moderate correlation, some points are more spread out which shows that some boys are a lot taller than others. The most common weight is around 50 to 65kg and height being around 1.6 to 1.8m. This scatter graph proves my hypothesis.
Looking at the girls graph, you can see that it is no way near as high up or spread out as the boys graph. Again there is moderate correlation, most girls weigh around 40 to 50kg and are mostly 1.6 to 1.8m in height. There was one point that didn’t quite fit the correlation, which you can clearly see on my graph as this girl was way shorter than the others.
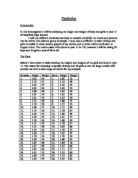
Mean
The mean gives an average of a set of data, so I am now going to use the mean to work out the average height and weight for the two genders and again, compare them.
Boys
Mean Height= 1.71+1.72+1.77+1.86+1.75+1.72+1.62+1.67+1.55+1.78+1.6+1.68+1.62+1.8+1.58+1.85+1.62+1.96+2+1.82+1.94+1.67+1.86+1.68+1.68+1.62+1.68+1.7+1.67+1.92+1.52+1.62+1.67+1.76+2.06+1.63+1.51+2+1.78+1.7+1.84
= 72.69
--------- = 1.7m
42
Mean Weight=
57+63+57+56+60+58+52+50+54+67+38+50+51+72+54+73+63+93+86+52+80+60+80+63+56+92+58+56+70+45+38+48+60+62+84+59+38+60+37+72+54+76
=2554
------- =60kg
42
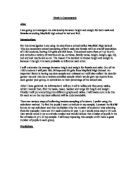
Girls
Mean Height=
1.67+1.62+1.63+1.72+1.73+1.63+1.69+1.62+1.65+1.65+1.61+1.52+1.68+1.63+1.72+1.62+1.65+1.60+1.63+1.80+1.52+1.68+1.69+1.62+1.55+1.63+1.61+1.59+1.62+1.58+1.73+1.72+1.33+1.65+1.54+1.65+1.52+1.69+1.76+1.52+1.60+1.69+1.67
=70.23
------- =1.6m
43
Mean Weight=
52+56+44+51+64+47+51+54+66+42+54+38+47+45+60+51+54+48+52+42+44+50+54+42+60+48+45+42+38+48+48+51+55+54+65+59+44+42+56+48+55+50+48
=2164
------- =50kg
43
As you can see, the average height for boys is 1.7m and the average weight is 60kg. The girls average height is 1.6m and their average weight is 50kg. This shows that my hypothesis is right.
As you can see from the pie charts, again my hypothesis is true, the taller boys get the heavier they are compared to girls.
I have collected quite a lot of data and it all proves that my hypothesis is true. There are some exceptions to the rule but generally as boys get taller they weigh more than girls.