Fair Test There are several ways in which I will try to make this a fair test. I will not change the slope, so that any deficiencies that may affect the speed of the bearing remain constant throughout the experiment. I will use the same ball bearing for these reasons, also. I will never move the ball bearing except in the cloth, which will minimise any sweat and oils from m fingers that may adversely affect the speed of the bearing. All the stacking blocks will be identical, ensuring that I always know by what amount I am increasing the height. Because of the need to use only one slope and bearing, and minimise accumulation of dust etc on the apparatus if I were to store them for later use, I will conduct my entire experiment in one lesson. I will repeat the test three times at each height as outlined in my method. This will hopefully mean that anomalies are kept to a minimum, and give a fair and balanced result. If I were to conduct only one test at each height, I would have no way of knowing whether the results I had obtained represented the true nature of the test, or whether they were anomalous. This would give me unreliable and possibly inaccurate results. However, to repeat the test five times may take too long, given the need to record the results accurately etc, for me to do this in one lesson. Another way I can ensure the fairest possible test is to conduct a trial run using the method stated above, so that I can see how it works out in practice and make any changes that might be necessary. I do not need to use the same slope and bearing for the trial as I do for the main experiment, as long as I use the same equipment throughout each. I will now conduct my trial run
Trial Run Having conducted this trial run, I can see that one change is necessary. This is to the method used for timing the bearing. Previously, I had hoped that I would be able to start and stop the time to an acceptable degree of accuracy while releasing the bearing. However, I found it hard to do this. Starting the timer was easy, but I found it difficult to synchronise the stopping of the watch with the ball hitting the end wall, and as you can see, this produced some anomalous results. I have decided, therefore, to change the method of timing. I will set up the apparatus so that the bottom of the slope rests near the edge of the table, facing outwards. A partner will kneel on the floor so that they can look from the bottom of the slope. They will start the watch at my prompt, and stop it when the ball hits the end wall. They will be in a much better position to see this than I was, because they will be up close to the end. I feel this will mean that more accurate and fair results will be produced. I can now proceed to record my results for the main run of the experiment.
Analysis
I can identify a number of trends in my results. When height (and so potential energy) is halved, the time taken is, roughly speaking, squared. This supports the theory put forward in my hypothesis that since k.e. = ½ m/s2, and that if kinetic energy is relative to speed, it is therefore relative to time. This trend can be explained because of the way raising the height increases the potential energy of the ball bearing, thus meaning the speed is increased, and affecting the formula for kinetic energy.
The other trend in my results is also quadratic – when the gradient of the slope doubles, the time squares – this is the direct opposite of the trend relating to the height and the p.e. – a lower value for the gradient, in this case, means a steeper slope and a higher starting position, which means more potential energy and thus more kinetic energy and a faster time.
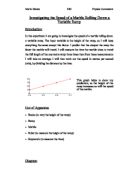
Having identified these trends, I will now draw a graph. I have decided to graph the time taken by the ball bearing against the relative potential energy it held at the start of the run. I will graph in this way as I feel this is the most relevant data and the easiest to talk about.
I will process my evidence by taking the average times from the three runs. I will do this because I feel that it will be the best way of displaying balanced and reliable results. I will show a line on my graph representing the raw data, and a curve of best fit. I will do this so that any anomalous results do not affect too heavily my perception of the processed evidence. Here is the graph of my processed evidence.
Conclusion My processed evidence shows the quadratic mathematical nature of the relationship between the potential energy and the time taken. The curve of best fit shows the fairly consistent nature of the trends in my results, although this is somewhat disrupted in the raw data by one anomalous result, which will be commented on further in my evaluation.
My evidence can thus be concluded as showing that increasing the potential energy of the ball bearing decreases the tine taken for it to roll down the slope, in accordance with the formula for kinetic energy, showing that increasing potential energy increases kinetic energy in a quadratic proportional manner.
This conclusion can be explained by the scientific theory of potential energy: p.e. = mgh, so as the mass and gravity remain constant, the only variable in this equation is the height, which I changed during the experiment. Therefore, the height is directly proportional to the p.e., meaning that doubling the height doubles the p.e. This explains the way that the ball bearing showed more kinetic energy at greater heights, in accordance with the equation for kinetic energy.
Analysis of my prediction My evidence supports my prediction in several ways. The general trends that I predicted can be seen clearly in my evidence – increasing the height and thus the p.e. of the bearing, and decreasing the value of the gradient, do decrease the time taken. Also, my prediction was accurate on the point that doubling the height would have a proportionally quadratic effect on the time – this is quite clear from my processed evidence.
However, there was one major flaw in my prediction, which needs to be addressed. The evidence I have collected shows that the gradient has a quadratic relationship with the time taken by the ball bearing, not a linear one as I set out in my prediction. In this way, my evidence undermines my prediction, as I had suggested that halving the value for the gradient would halve the time taken for the bearing to roll down the slope.
I am now in a position to write an improved prediction based on the evidence I have collected, thus, my prediction would have been better if I had said:
I predict that increasing the height, and thus the p.e., of the ball bearing, will decrease the height in a quadratic manner, such that halving the height will square the time taken. Also, since the gradient is proportional to the height, doubling the value of the gradient will also square the height.
I can now evaluate my evidence.
Evaluation
Quality of Evidence In my investigation I was able to measure fairly accurately by taking times to the nearest hundredth of a second. This gave very accurate results, especially after averaging. However, the accuracy of my measurements may be limited because of the fact that it was impossible to automate the timing in any way, so that human error is possible, although less likely after the changes I made following my trial run. Overall, given this level of accuracy, my evidence should be of reasonably high quality.
Anomalies There is one major anomalous result in my evidence, which is anomalous across the three runs: this is the time for height 3.5, relative p.e. 35. The time is too great to fit with the general trends of my results, being only 0.01 of a second less than the time for the height just below it.
There are several explanations for the anomalous result, which is especially evident in the third run of the experiment. It is possible that there was human error in the timing: the timer would not have to be overly inaccurate to make a mistake which would make this result anomalous. However, this explanation does not provide satisfactory explanation for the fact that all three runs at this height produced results that look anomalous. This same doubt can be applied to the explanation that extra friction caused a tiny variation in the time taken.
The most likely explanation for this anomaly is that the last block placed under the ramp, on the stack, was slightly less than 50mm high, due to slight erosion, or to the way it was placed on the stack. This would have meant a shift in the results, most evident in the result collected directly after the block was placed on.
Reliability The apparatus I used could have been improved if I had used a ramp with less friction and variation, instead having access to a smooth, polished surface, minimising friction and variation and thus increasing the reliability of my results, as the ball bearing would have interacted with the surface of the ramp in a more consistent manner.
There is another way in which my apparatus could have been improved – if I had used a more accurate and reliable stopwatch to measure results – a more highly technical display and operational system would have meant that the stopwatch would have been easier to use, increasing the reliability of my results.
The techniques I used to conduct this experiment could also have been improved – instead of using a cloth to hold the ball bearing, I could easily have used a surgical or sterilised glove. This would mean that any minor impurities would not affect the results in such a way that, when the differences are just hundredths of seconds, could be crucial.
I could have decreased the chance of anomalous results by checking the height of the stack directly before each experiment, instead of assuming that it was the height I desired, and by using better apparatus and techniques as set out above.
Sufficiency of Evidence Given my evidence, it is likely that my conclusion is correct, as there are no results which truly contradict it. However, we have to accept that my results show a limited range of gradients of the slope, and that if the gradient was made much steeper, the times would be out of proportion with the formula, and that if it was made shallower, the ball bearing would not roll at all. Thus, though my evidence is indisputably sufficient to support my conclusion over the range of values for the potential energy of the ball bearing which I tested, the formulas the evidence conforms to is irrelevant to other values, so I cannot know how true my conclusion is in these values.
Further Work There is further, similar work I could do to help continue my investigations into this variable and help ascertain the verity of my prediction and conclusion.
I could use a metal ball, larger than a ball bearing, and a longer, smoothly polished wooden slope which I could quite easily construct myself. I would set up the slope against a meter rule placed vertically, so that I could easily vary and control the starting height. The slope would be longer and the whole experiment enlarged in this simple and practical way so that it would be much easier to time the experiments and eliminate human error to the greatest extent possible.
This further work would help me to answer the original question of how potential energy affects kinetic energy and speed, while increasing the ease of conducting the experiment by making the slope smooth and longer to reduce friction and variation, and to make it easier to take accurate measurements.
Ben Karlin 11SDB