As a result of the calculations and diagrams I can compare the heights and weights of males and females.
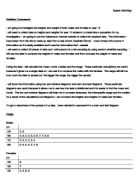
To get a visual idea of the spread of my data, I have decided to represent it in a stem and leaf diagram:
Height
Males:
Females:
Mixed:
As you can see from the above diagram:
- The shortest person in the year is 130cm and the tallest person is 180cm.
- Most of the people in the year were between 160cm and 170cm in height.
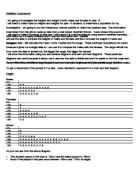
Weight
Males:
Females:
Mixed:
As you can see from the above diagram:
- The person who weighs the least weighs 40kg, the person who weighs the most weighs 72kg.
- Most of the people in the year weighed between 50kg and 60kg.
From my stem and leaf diagrams it is now possible to calculate the mode, median, mean and the range.
Height
Males:
- Mode – 180cm
- Mean – 170.62cm
- Median – 169cm
- Range – 39cm
Females:
- Mode - 160cm, 170cm, 173cm
- Mean - 164.63cm
- Median - 164.5cm
- Range - 41cm
Mixed:
- Mode - 180cm
- Mean - 161.08cm
- Median - 163cm
- Range - 50cm
Weight
Males:
- Mode - 58kg, 50kg, 60kg
- Mean - 52.42kg
- Median - 58.5kg
- Range - 32kg
Females:
- Mode - 45kg
- Mean - 50.92kg
- Median - 50.5kg
- Range - 24kg
Mixed:
- Mode - 45kg, 60kg
- Mean - 54.3kg
- Median - 54kg
- Range - 32kg
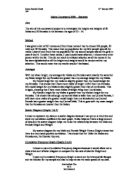
I have now decided to represent my data in box and whisker diagrams:
Weight
The median weight for males in year 10 is 58.5kg compared to the median weight of 50.5kg for females. This shows that, in general, the males generally weighed more than the females. The width of the box represents the interquartile range, a measure of variability of the data. The diagram above conveys to me that there is more variability in the males data, this is because there is a wider box.
The box plot for the mixed weights is roughly symmetrical, the median is in the center of the box and the whiskers are of similar length. This shows that the distribution of values for the mixed weights is roughly symmetrical. In comparison, the median for the males is towards the right hand end of the box and the whisker to the right is considerably longer than the whisker to the left. This indicates that the distribution of values for the males is negatively skewed. The median for the females is towards the left hand end of the box and the whisker to the right is considerably longer than the whisker to the left. This indicates that the distribution of values for the females is positively skewed.
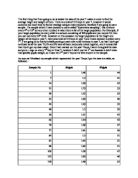
Height
The median height for males in year 10 is 196cm, in comparison to the height of 164.5cm for the females. This shows that, in general, the males were generally taller than the females. The box for males is wider and this shows to me that there is more variability.
The box plots for the mixed heights is roughly symmetrical, the median is in the center of the box. This shows that the distribution of values for the mixed heights is symmetrical. The median for the males is towards the left hand end of the box and the left is considerably long than the whisker to the right of the box. This indicates that the distribution of values for the male’s heights is positively skewed. In comparison, the median for the females is towards the left hand end of the box, the whisker to the left is longer than the whisker to the right of the box. This indicates that the distribution of values for the female’s heights is positively skewed.
I am now going to present my data in a combined cumulative frequency and percentiles table:
Height - Males:
Height – Females:
Weight – Males:
Weight – Females:
Analysis:
I began this investigation with the aim to find the average heights and weights of males and females in year 10. From this investigation I found out that the average height for a student in year 10 was 161.08 cm and the average weight for a student in year 10 was 54.3kg.
I also found out that the average weight for females are in 10 was 50.93kg, that the lightest female was 42kg and the heaviest was 66kg, giving a range of 24kg. In terms of height, the average height for females in year 10 was 164.63cm, the tallest female was 180cm and the shortest female was 139cm, giving a range of 41cm.
For the males the average weight was 52.42kg, the lightest male student was 40kg and the heaviest was 72cm, giving a range of 32kg. In terms of height, the average height for a student was 170.62cm, the shortest male student was 150cm and the tallest was 180cm tall, giving a range of 39cm.