Preliminary work 2:
I also investigated the distribution and abundance of organisms on a sheltered rocky shore. I placed a 30m tape measure from the lower shore up to the upper shore; I then used a 1m² quadrant, which was used to define a sampling area starting from the lower shore slowly moving up to the upper shore. The number and type of specie found in each quadrant was then recorded. I was then able to produce a profile graph, which showed me the distributions of different organisms in transect at Frenchman’s steps. This preliminary work has helped me with my final investigation because I have had practice in recognising different organisms and so I would be able to distinguish between limpets and other organisms which look similar.
Preliminary Work 3:
I also carried out a small investigation on rough periwinkles, where I was investigating if exposure to wave action affects rough periwinkles shell morphology. I used callipers to measure the height of each periwinkle; therefore this investigation gave me the practice in using callipers, as I would need them in my final investigation to measure the shape of each limpet. I was also able to form a sample graph from this information which helped me decide how many samples to take when measuring the shape of a rough periwinkle. I can use these results when deciding how big a sample of limpets to take.
Equipment:
I used the following equipment in my investigation:
Calliper - this is a piece of equipment which will be used to measure the width and height of the limpets. A calliper was used as it is accurate to ±0.1mm rather than a ruler which is accurate to ±1.0mm.
Tape measure (30m) - this will be laid across the shore at the vertical heights of 3m and 6m, so random co ordinates can be chosen from it.
Metre ruler- this will be used when finding the vertical height up the sea shore.
Optical level - this is a wooden block with a hole on the base where you look, to find the vertical heights of 3m and 6m.
Tide tables- I need this to know where the tide level is at certain times.
Pencil, recording sheet and clipboard- these are required to record all the measurements that are taken.
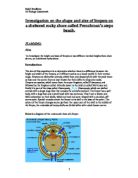
Location: Frenchman’s Steps
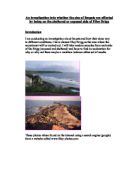
I have chosen Frenchman’s steps at Dale fort in Wales with SM 819 064 to carry out my investigation. Frenchman’s steps is a sheltered shore, the reason I chose a sheltered shore over a exposed shore is that limpets are more abundant at sheltered shores, because sheltered shores have the most ideal conditions for limpets to live. Sheltered shores usually face away from the open sea and the prevailing wind which get less sunlight than exposed ones, and are less susceptible to desiccation and in general are more hospitable places for limpets. This means there will be a greater number of limpets at sheltered shores which will give me better results, as I have more to work with which will make it possible to make an accurate statistical analysis. This could be difficult at an exposed shore as there are hasher abiotic conditions, which makes it an inhospitable place for limpets to live and therefore reducing the growth and number of limpets.
Hypothesis:
Ho- There will be no statistically significant difference between the sizes of limpets found on the upper shore than on the lower shore.
H1- There will be a statistically significant difference between the sizes of limpets found on the upper shore than on the lower shore
Plan:
I have decided to carry out my investigation at a sheltered rocky shore Frenchman’s steps, the following procedure will be carried out at the shore:
-
I will be taking my measurements at 2 different vertical heights along the shore. I have chosen 3m and 6m as my 2 vertical heights, I chose these heights by looking at my preliminary work 2 of the density of different species up a shore. From looking at this preliminary work I was going to choose the area which showed me the part of the shore where the limpets appeared to be most abundant. However from looking at my preliminary work I can see that limpets are spread throughout a shore. Therefore I chose 3m which fell in the lower part of the middle shore and I chose 6m which falls at the lower part of a upper shore because I felt it was this wide range which would give me a bigger difference if there was one present and so the greater difference will improve accuracy of my results, and measurements of greater magnitude reduce the uncertainty values
-
Now that the 2 heights have been chosen, the following technique using an optical level and metre ruler will be used to find the 3m point. This involves a person standing at the waters edge during low tide which is 1.3m at the time of 12.16pm on the 8th October 2003 at Frenchman’s Steps in Wales at dale fort. I knew that the lowest tide was 1.3m at 12.16pm on the 8th of October 2003 because the tide table below tells me this which was given to me by the field centre. The person who is standing at the water edge places the metre ruler at the edge of the water with the 0m side against the ground, then place the top of the optical level in line with the 1m point on the ruler. Then looks directly down the gap in the optical level and directs a friend to the point that can be seen through the gap.
- This point that the friend is standing at is 1m above low tide which is 1.3m, so 1.3m added to 1m is 2.3m from chart datum. However the height required is 3m so we need to go up another 0.7m to be at the 3m point. To do this you need to go with the metre ruler and optical level and stand at the point where the friend is, from here you measure 0.7m. By placing the top of the optical level in line with the 0.7m mark, and again finding the point and directing a friend to that point. This is now the 3m point, from where all the measurements will be taken.
- Now a 30m tape measure is placed horizontally along the shore at 3m, it is kept in place by large rocks so it doesn’t blow away. Once the tape is placed down to make sure that the whole tape measure is level at 3m, it is necessary to use the metre ruler and optical level to measure from the waters edge back to the tape measure from different positions along the shore.
-
Next I will take measurements of the limpets; I have decided to choose random sampling to choose where along the 30m tape measure I would measure limpets from. I will pick random co-ordinates along the tape measure and measure the limpet at that point. I chose random sampling because I thought it would give me fair and unbiased results, because this way not all the limpets were measured at one point but were measured right across the vertical height of 3m. (14.5)
- I have decided to measure 25 limpets at each vertical height, I choose this number from my preliminary work 3 on rough periwinkles. I have included a graph of sample size against mean value in my preliminary work. From the graph you can see that the graph levels off at the point of 9 to 11 samples which means 9 to 11 samples is enough measurements to make an accurate statistical analysis. So from this preliminary work I know 11 is the minimum sample size I need to take. However I chose 25 samples because I am investigating limpets which are different specie to rough periwinkles and so there would be a difference in sample size. Also more samples mean more measurements and so more accurate the final statistical analysis will be.
- Next I will use a calliper to measure the height and width of each limpet.. I will have to keep my measuring technique constant by measuring the width of the base and the height perpendicular to the rock surface of each limpet in the same way. If I use the same method each time it will minimise the chance of inaccurate results. I will then record the width and height of all 25 limpets in a table like the one below in the results section. I will also use chalk to mark the rock next to each limpet so I know which limpet I have measured so I don’t measure the same one again, which could make my results inaccurate if the same limpets are re-measured.
- Now the whole procedure will be repeated for a vertical height of 6m, and the same sample size of 25 will be taken and the same equipment will be used, and all the results will be put into the table like the one shown below.
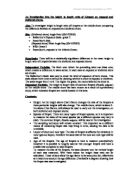
Safety:
There are many safety risks associated with doing field work on a shore. Whilst carrying out this investigation the following must be taken into consideration:
Tidal cut-off: this is when the tide can come in too close, this is very dangerous and to prevent it from occurring it would be sensible to check the position of the tide along the shore on a regular basis.
Sensible shoes must be worn with plenty of grip, preferably Wellington boots as the rocks are very steep and slippery, which can be dangerous.
There is always strong winds at the shore especially October time, so wearing thick layers and water proof clothing will keep you warm and dry, preventing you from getting ill.
Gloves should always be worn when handling animals and plants, and hands should always be washed thoroughly after being on the shore. To prevent any contamination from occurring.
You should always work in groups of 3 or more, never alone in case a problem or injury was to occur.
A risk assessment sheet should be filled out with all appropriate details and carried with you at all times, so you have all the information if required in the case of an emergency. I have included a risk assessment sheet for Frenchman’s Steps.
A first aid box should be carried at all times in case an injury or accident occurs.
Ethnical implications:
When we carry out our investigation we will be working on natural habitats, so we need to be considerate to all the living organisms, we have be careful not to damage or trample on plants and animals unless its absolutely unavoidable as it can be very damaging to the species. If rocks and species are moved out of place make sure to put them back in their original place to cause least disruption as possible.
RESULTS:
The following are the results which were obtained from my investigation.
Above I measured the height and base of 25 limpets I then used that information to work out a height: base ratio, which I did by dividing the height by the base. This tells me for every 1mm the height increases the base increases by the number in the height/base ratio column.
Example: for sample number 1 in the table, the height/base ratio is 0.43:
Height = 10 Base = 23
10 = 0.43
23
Now I have found the height/base ratio for each limpet, I can use this to find if there is a statistical difference between the height and base of limpets at 2 different height on a sheltered rocky shore. To find a statistical difference I will be using the T-Test, I choose this test because a T-Test is used when you want to see if 2 means are significantly different. I will be looking at the means of the height/base ratio of limpets at 3m and at 6m. I will also be using the result of the T-Test to accept of reject the null hypothesis.
The following equation is used to work out the value of the T-Test
t = X1 - X 2
√ S1 ² + S1 ²
n n
X1 : stands for the mean for the first set of data which is the mean of the limpets at 3m.
X2 : stands for the mean for the second set of data which is the mean of the limpets at 6m.
The equation to work out the mean is
Mean = Σx/n
S1 ²: stands for the variance for the first set of data which is the variance of the limpets at 3m.
S2 ²: stands for the variance for the second set of data which is the variance of the limpets at 6m
The equation to workout variance is
Variance (s²) = Σx² - (Σx) ²
n
n – 1
I am now going to work out the t value using my results above in the table, to do this I need to work out the Σx² for both sets of data, which is required when the variance needs to be calculated, which I will do in the table below.
First I will work out the mean for both sets of data:
X1 (3m mean): Σx1/n
9.51/25 = 0.3804
X2 (6m mean): Σx2/n
17.28/25 = 0.6912
I will now work out the variance for both sets of data:
S1² (3m variance): Σx1² - (Σx1) ²
n
n – 1
3.8637 - (9.51) ²
= 25
25 – 1
3.8637 – 90.4401
= 25
24
= 3.8637 - 3.6176
24
= 0.2461
24
= 0.01025
S 2² (6m variance): Σx 2² - (Σx2) ²
n
n – 1
12.7366 - (17.28) ²
= 25
25 – 1
12.7366 – 298.598
= 25
24
= 12.7366 – 11.944
24
= 0.7926
24
= 0.0330
Now that I have calculated the mean and variance for both pieces of data I can find the t value by substituting the above values into the formula below, which will then tell me if I have a significant difference between the 2 pieces of data.
t = X1 - X 2
√ S1 ² + S2 ²
n n
= 0.3804 - 0.6912
√ 0.01025 + 0.0330
25 25
= 0.3108 8
√ 0.00041 + 0.00132
= 0.3108
√0.00173
= 0.3108
0.0416
= 7.47
I now have my t value of 7.47, and the next step is to compare the answer with the critical value from a standard statistical table, after that I will be able to reject or accept my null hypothesis. To find the critical value you need a statistical table and, you need to find the Degrees Of Freedom and the Significance Level.
Degrees of freedom are the total number of samples taken for each set of data added together and then you subtract the number of sets of data you have:
DF (degrees of freedom) = (25 + 25) – 2
= 48
The Significance Level is always 5%, this is the level normally used in biological investigations. When we reject the null hypothesis at the 5% level we will be correct in doing so 95% of the time.
I now have all my information to find a critical value. If the calculated t value is bigger than the critical value we can reject the null hypothesis, however if the calculated t value is smaller than the critical value we then accept the null hypothesis which means that the investigation has no significance.
From looking at the statistical table I have a critical value of 2.021. This value is smaller than my calculated t value of 7.47, which means I can reject my null hypothesis which proves my 2 means are significantly different.
I am now able to plot my results in a bar graph, which will make my results clearer and easier to compare and analysis. To plot this graph I will be using the ratios of both sets of data. I will form a table below to tally the ratios into groups which will enable me to construct my graph.
CONCLUSION:
From looking at all my results, the graphs, tables and the statistical test, I can conclude that my hypothesis is correct. The sizes of limpets found on the upper shore are bigger than the size of limpets found lower down the shore at Frenchman Step’s.
Firstly from looking at my table of results, I can see that the height/base ratio were lowest at the vertical height of 3m from chart datum. The greatest height/base ratio at 3m was 0.65, and the lowest ratio was 0.25. Furthermore the greatest height/base ratios were at the vertical height of 6m from chart datum, at this point the greatest ratio was 1.38, and the lowest ratio was 0.44. This tells me a lot because from looking at the graph, I can see that there are 9 limpets between the ratios of 0.31- 0.40, which is the most common ratio at 3m. However the ratios of 0.21 – 0.30 and 0.41 – 0.50 are also very common ratios as there are 7 limpets measured between the ratio of 0.21 – 0.30 and 6 limpets measured between the ratio of 0.41 – 0.50.
These ratios are most common at the point of 3m because the heights of the limpets need to be quiet small as they need to be quiet flat, and their bases need to be bigger than the height so their foot has more suction. The limpets lower down the shore are always exposed to strong winds as well as strong wave action, so the flatter the limpet is and the wider the base is the more resistance the limpet has to the force of the tides, which will prevent the limpet from being washed away. The growth of a wider than normal base results in a structure that is more stable as the centre of mass is closer to the ground, as well as increasing the suction area of the limpet foot. Both these factors would increase the chances for a limpet to remain attached to the rock surface in spite of the intense and powerful wave action it experiences. Also Species living at the bottom of the shore are adapted, in that the risk of desiccation is far less for limpets at the vertical height of 3m and so they don’t have to be as big as the limpets at 6m. Because the limpets are always in contact with water and so even though the volume: surface area ratio is higher, and so consequently they would have greater rates of evaporation, the limpets are still able to survive, as this zone get covered in water for about 80% of the year. So these height/base ratios found at 3m are most suitable for the limpets as they live in such harsh conditions and so these low ratios will make the limpets more streamline in the water, which will prevent them from being washed away.
Yet I also found limpets with quiet a large height/base ratio at 3m, however there were only a few limpets measuring between these large ratios as only 2 limpets have ratios between 0.51 – 0.60 and only 1 limpet with the ratio 0.61 - 0.70. These height/base ratios are quiet high, which means it could make the survival of limpets extremely difficult as they aren’t adapted to survive in the harsh conditions lower down the shore at the height of 3m. However theses bigger ones may appear there because in October there are extremely rough seas which tend to induce the spawning of limpet gametes into the sea, so the larger limpets aren’t usually found at the bottom but due to the time of the year they appeared there.
There are few limpets at 3m in the grouped ratio of 0.51 – 0.60 and 0.61 – 0.70, but the majority of limpets at 6m appear in these groups, with 12 limpets measured between the ratio of 0.61 – 0.70, and 3 measured in the group of 0.51 – 0.60. There was also 4 limpets measured in the ratio between 0.71 – 0.80. It was these 3 groups which are the most common height/base ratio size for limpets at the vertical height of 6m. These ratios are large ratios which mean the height of the limpets is a lot larger and the base is also very large. Seeing that the problem experienced lower down the shore where the limpets have to have a small ratio so they are more stream line and more resistant to the strong wave action which can dislodge the limpets and wash them away isn’t a major problem higher up the sea shore. This is because the upper shore only gets covered by the sea for <1% of the year which means less water is received by the limpets, and so the wave action isn’t as strong as lower down the shore. This means that limpet’s desiccation is a major factor affecting the limpets. We know that limpets on the lower shore lose water rapidly, whereas limpets higher up the shore lose water very slowly. In other words, the limpets found higher up the shore have adapted to the increased risk of desiccation, or drying out, experienced at this part of the shore. The way in which limpets are adapted are that they have a lower surface area: body volume ratio which means less water is lost and the larger body size means more water can be stored in the limpet which helps it to survive when the tide is low, as it prevents it from drying out.
The base of the limpets is still very large even thought it experiences very little wave action and so wouldn’t need to cling to the rocks tightly to prevent it from being washed away. However the base of the limpets on the upper shore is still very large and suction still occurs. For the reason that limpets still have to cling to the rock very tightly at low tide to prevent them from drying out and keeping all the water within the shell. Overall the base in the lower and upper part of the shores is important because they both require the strong muscular foot to crab on to the rocks surface.
From the graph, I also noticed that there were 2 limpets measured with a large ratio between 0.91 – 1.00 and 1 limpet measured with a extremely high ratio in the group 1.31 – 1.40. From these results I conclude that these are very old limpets that are still growing. I know that the average lifespan of a limpet varies considerably depending on environmental conditions. Where there is lots of algae and food the limpets will be larger, and so growth is fast, and so from this I propose that, this seashore is abundant in algae and the environmental conditions are suitable for the limpets. The limpets are adapted to feed mainly on micro algae using a shovel shaped radula; the radula is swept back and forth across the rock removing the micro algae. Algae is most abundant on a sheltered shore, it is spread evenly throughout the shore with a greater amount of algae in the lower and middle shore
Finally from the graph you can see that the middle groups starting from 0.41 – 0.70 had limpets of the same ratio at the vertical heights of 3m and 6m. I think it is this point that the limpets are slowly moving up shore. The reason why larger limpets are found higher up the shore is because as limpets grow they move up shore because their shell shape and size is changing and so adapting to a different way of life and environment. Limpets move up shore for many reasons such as large number of predators lower down the shore and there is a lot of competition for space which can be a major problem as the limpets grow and become bigger. Also their shell shape and size isn’t suited to the environment lower down the shore, as limpets of greater height would not be as hydrodynamic and so would experience more pressure due to the water flow. These organisms would more likely overturn especially under conditions of increased wave action. So I think it is at these ratios 0.41 – 0.70 that limpets begin to move up the shore where the environment is more hospitable and adapted to their shell shape and size.
To confirm my graph and table of results I carried out a statistical test, which was the T-Test. In order to show that there is a statistically significant difference between the shapes of limpets, as quantified by their width: height ratio, on 2 vertical heights of 3m and 6m it was necessary to perform further mathematical analysis. This takes into account the level of significance of the results used, that is the probability that the differences between the measured values and the actual values are due to chance. Also the number of comparisons made between measured and actual values also known as the degrees of freedom. In this experiment, the level of significance is equal to 5%, the standard value used in biological experiments, and the degrees of freedom is 48. Using the table of T-distribution, the critical value for this experiment can therefore be shown to be 2.012. The t value was calculated to be 7.47. The t value confirmed my answer that limpets are bigger higher up the sea shore. This then enabled me to reject my null hypothesis which was, there will be no statistically significant difference between the sizes of limpets found on the upper shore than on the lower shore, which I was able to do once I compared my critical value with my t value. Seeing that 7.47 is greater than 2.012 I was able to accept my hypothesis which was, there will be a statistically significant difference between the sizes of limpets found on the upper shore than on the lower shore.
Overall from looking at all my results I can conclude that my hypothesis was correct and that limpets found lower down the shore are smaller than the limpets found higher up the shore. You can see this from my results table and my graph and to confirm this I proved there was a statistically significant difference between the size of the limpets found at 2 vertical heights from chart datum along a sea shore.
EVALUATION:
From looking at my results, overall I am happy and pleased with my achievement. As I have been able to reject the null hypothesis and I proved that there was a statistically significant difference in my investigation by using a T-Test. Still there were a number of improvements, which I could make to achieve the most accurate results.
The investigation I carried out was quiet flawed, in that there were many variables which I couldn’t control such as the weather and the type of limpet specie I was measuring. The variable I have least control over is weather, such as temperature, wind speed, humidity and wave action. Also although possible it would be difficult to determine the species of each limpet that is measured due to time constrictions, which means we could be measuring different specie and not the Patella Valgata.
As well as this when I choose a random co-ordinate on the tape measure, there might be more than 1 limpet present at that point which means when I went to measure the limpet, I could choose the biggest or smallest or widest limpet, which ever limpet appealed to me most. This would make my investigation unfair and biased and so, consequently all these would undoubtedly decrease the accuracy of the data obtained and therefore also the reliability of my conclusion.
Another error which could have occurred with the measurements of each limpet, is that limpets are shells which are common places for barnacles which are another type of inter tidal organism, to live on. So when I was measuring each limpet a barnacle may have been joined on top which would have increased the height of the limpet, therefore giving me inaccurate results and also making my overall conclusion and t value inaccurate or completely wrong.
Another fault which could have occurred is that the strong winds which are present during the October month could have blown the tape measure which was put across the shore, so when our co-ordinates were chosen we might have been below or above the 3m or 6m mark, which would have meant we were measuring limpets at a different height which would overall make my results incorrect.
Another error which could have occurred, is with the use of an optical level, the optical level is a very basic piece of equipment and when I used it to find the vertical height of the shore I could have misjudged were the 3m point is which means I could be measuring limpets at the wrong point, which would overall be giving me inaccurate results as well as a incorrect t-value for my statistical test.
Another error which can arise in this investigation is the accuracy of any measurement made; any measurement will inevitably be limited by the accuracy of the apparatus used. For this reason, a calliper was used as it is accurate to ±0.1mm rather than a ruler which is accurate to ±1.0mm. However, there will still be a percentage uncertainty associated with each measurement, which overall would make my experiment inaccurate and my conclusion wrong and unreliable.
The percentage uncertainty associated with the measurements by the calliper can be calculated as follows:
Say height of a given limpet is measured to be 12 mm, therefore
Percentage uncertainty = accuracy x 100
= 0.1 x 100 = 0.813%
Reading 12
The experiment was designed to reduce the percentage uncertainties associated with each measurement, but overall trends in the data will still be accurate enough to make reliable conclusions. In other words, the systematic error, that is the error resulting from apparatus, will have no significant effect upon the accuracy of the results, which means my results are still inaccurate but not enough to make my conclusion unreliable and so conclusion is still dependable.
Considering the above it is feasible to say that the results obtained during the experiment are likely to be neither very reliable nor very accurate, considering that there was so much possibility for inaccuracy, there was not however any major anomalies in the results obtained. At the vertical height of 3m from chart datum all the results looked quiet ordinary, however there was the following height/base ratios which did seem out of place.
The above measurement of limpet number 13 on the lower shore at the height 3m seemed out of place compared to all the other measurements. The height/base ratio was 0.65 which is quiet high compared to all the ratios. However the reason for this could be that this bigger one may appear at the vertical height of 3m because in October there are extremely rough seas which tend to induce the spawning of limpet gametes into the sea, which means this limpet may have just moved to lower shore to release its gametes. Which is the explanation to why the larger limpet was present at the vertical height of 3m.
At the vertical height of 6m, there were a few height/base ratios which didn’t fit into the general pattern of height/base ratios, which I would call an anomaly. The following height/base ratios seemed out of place:
The above measurements of limpet’s number 15, 22, and 23 on the upper shore at the height 6m seem out of place compared to all the other measurements. The height/base ratios are very high compared to all the other ratios. The explanation for these anomalies could be that these limpets have managed to live a long life and so grown to extremely large sizes, and that these are very old limpets that are still growing. I know that the average lifespan of a limpet varies considerably depending on environmental conditions. Where there is lots of algae and food the limpets will be larger, and so growth is fast, and so from this I propose that, this sea shore is abundant in algae and the environmental conditions are suitable for the limpets.
There are explanations for why these results looked out of place, however these results could still be anomalies, which may have risen due to a number of reasons. Firstly, one of the most common specie, the barnacle could have been present on the limpet which I hadn’t noticed. So the overall height of the limpet had increased giving me greater height/base ratios which stood out of place. Or misidentification could of occurred where I could have measured a different type of limpet and not a Patella Valgata, which may be bigger in width and height compared to a Patella Valgata the common limpet which my investigation was based on. To overcome these problems I would have spent more time on the shore and examined each limpet before I measured it to make sure I was measuring the common limpet a Patella Valgata and to make sure no barnacles were attached to the top of the limpet. This way my results would be more accurate and reliable.
Or it could have been human error, in that my measurements using the calliper could have been inaccurate, as I could have misread the calliper and recorded a larger figure than it was. Also the optical level was a very basic piece of equipment to use to find the vertical heights on the shore and so I could have misjudged where the 3m point was. To overcome these inaccuracies while carrying out my investigation I would have measured each limpet more than once to make sure I was getting the same answer each time. Also I would follow one technique of measuring each limpet. To make sure I was at the right height on a shore I would not use an optical level, but instead a different technique called cross staffing. This involves one person standing at the waters-edge, using a cross staff to direct another person to the required height up the shore. When using the cross staff, I would make sure that it was kept level by regularly checking that the air bubble was midway on the scale, this technique would be a lot more reliable and accurate.
These anomalous results could have made the value for my statistical test inaccurate, since these anomalous results were used when calculating the t value, which could of made the t value higher than it should have been. To improve this I should have missed out these results. Not including some sets of results when making t value may have led to a better and more accurate t values.
If I was to carry out this investigation again, I would do many things different, I would use different techniques such as cross staffing to find my vertical height on the shore. I would measure all limpets more than once and use the same equipment each time. I would also make sure that I placed the tape measure along the shore at the right vertical height and secured it properly so it doesn’t blow around even if there is strong winds, which will prevent any measurements been taken from the wrong vertical height.. I would make sure I was measuring only one type of limpet which is the common limpet and I would do research on appearance of barnacles so I knew when a barnacle was present on a limpet. Lastly and most importantly I would take a larger sample size of limpets and I would increase the number of vertical heights I measured at so I could see the gradual change in limpet size and shape. And I would carryout the whole experiment more than once to make sure each time I was getting similar results. Overall this would give me the most accurate results and the most reliable conclusion.
To extend this investigation or to provide additional evidence for the conclusion and to overall make my investigation more accurate I could. Compare the abundance of Limpets on a sheltered and exposed rocky shore, 3m and 6m above chart datum. I could compare the size of Limpets 3m and 6m above chart datum, with distribution of green algae, on the exposed and sheltered rocky shores. This will show me how important food which is green algae was for the growth of limpets. I could also compare the density of Limpets at different vertical height above chart datum, with another animal such as barnacles, on the exposed and sheltered rocky shores. Since barnacles can be found on the limpets outer shell.
Overall I am pleased with my investigation, and pleased with my results and conclusion, and am happy to reject my null hypothesis and conclude that limpets present on the vertical height of 3m are smaller than the limpets present on the vertical height of 6m. However there is always room to extend and improve my investigation which will increase the reliability of my results and conclusion.
BIBLIOGRAPHY
I used the following books and websites whilst doing my investigation on the shape and size of limpets on the rocky shore:
- Further studies in biology,
by Margaret Baker
Bill Indge
Martin Rowland
- Understanding biology for advanced level,
by Glenn Toole
Susan Toole
by Ann Fullick
- I have used blue highlighted numbers in my investigation to indicate which part from the AQA 2004 biology specification A. course I have included in my investigation.