Line graphs and scatter graphs show the relationships of two different pieces of data in an easy to read way, when I draw the box plots I will draw them by hand and not use a computer, I will only use these graphs when the upper quartiles, lower quartiles, highest value, lower value and the median of data are not needed. To make the line and scatter graphs I will use a computer because it is more accurate and easier to use.
If there are any mistakes or odd ones out in my data I will simply delete that piece of data.
Hypotheses Analysis
The first graph shows that there is a higher positive correlation for the girls compared with the boys when looking at median height throughout the school years. This means that the height of the girls through years 7-11 increases more steadily and consistently than the boys, as their R-Value is closer to 1. The boys’ median Height however displays a steeper gradient trend line proving that they are consistently taller throughout their school life. The second graph shows that although both boys and girls make considerable weight gains throughout the years it is the boys whose trend line shows a more positive correlation and therefore the older they are the heavier they become.
The first graph, showing the mode height, proves that the most consistent amount of boys throughout the years (with the same height) increases steadily enough to produce a positive correlation on the linear line of regression. In comparison the mode height of the girls produces a neither a positive or negative correlation and we can conclude that the mode height of the girls varies very little throughout the years and is not the most helpful way of analysing this data. This is also the case with weight apart from the anomalous result for the boys in year 10 who show considerable weight gain.
If we look at the mean height we can see that both the boys and the girls have strong positive correlations throughout the 5 school years. This means that in general the older the girl or boy the heavier they are. The R-Value produced by the girls (R=0.97) shows that their data results are almost perfect in their gradual increase, meaning that each year the height may be seen to increase at a similar rate. In both graphs, both lines follow a very similar trend however the boys increase at a greater rate than the girls. We can conclude that, from looking at the mean, which the boys throughout the 5 school years increase in both height and weight in a more rapid fashion than the girls.
Conclusion
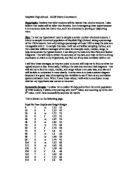
We can also use this method of cumulative percentage to analyse our height data but the results can be found to be very similar and inappropriate to my hypotheses. I also thought it would be useful to look at the average and standard deviation throughout the years because a large standard deviation indicates that the data points are far from the mean and a small standard deviation would indicate that they are clustered closely around the mean. Examples of this are:
The mean weight of the boys was on average 3.2kg heavier than the girls, however the boys standard deviation shows that they were further away from the mean compared to the girls whose standard deviation was only ± 3.34kg. This proves that my hypothesis was correct and boys are heavier than girls.
The mean height of the boys was only 2cm taller than the girls and standard deviation was only very slight. Both boys and girls heights had very low standard deviations therefore the data was very close to the mean. However, this can be seen to prove my hypotheses because the boys, although only just, are taller than the girls.
Throughout the graphs in my study an obvious trend has occurred although again only very slight. This is the trend between height of boys and girls throughout the years. Generally the boys have been taller than the girls although the correlations may have run similar courses. The graphs have shown that the boys and girls in higher year groups are taller than the boys and girls in lower year groups.