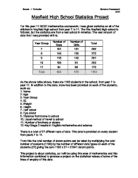
Highest and Lowest Values
By drawing a Scatter diagram, this will help me see if there is an y relationship between the weight and height of a pupil.
Graph Analysis (See Scatter Graph for Sample 1)
The correlation between the weights and heights of pupils is a weak, but positive correlation. This means that generally as the height of a pupil increases so does the pupils weight at a proportional rate. In this graph I was able to pick out a few examples as where this rule did not follow, the reason behind this is unknown because it might be caused by human error or is an anomalous result which appeared.
To estimate the weight of someone with a particular height, say “1.75M”, I drew a vertical line from “1.75” up towards the line of best fit, and then followed a horizontal line towards the weight axis, obtaining a weight of about “60 Kg”. I could do the same for any height between “1.5” and “1.8” M and obtain a reliable estimation for the weight.
Histogram (See Histograms for Sample 1)
Frequency (Weight)
Frequency (Height)
Modal Values and Intervals
Weight: Modal class interval is “41<50 Kg”
Height: Modal class interval is “1.41 < 1.60 m”
Stem and Leaf Diagrams
Using a “Stem and Leaf” diagram, it helps view the shape of the set of data.
Random Order (Weight)
1
2
3 8 2
4 8 0 5 2 2 5 7 2 8 2
5 7 0 1 2 0 6 1 0 9 0 8 9 9 5
6 3 0 2 5 4
7 0 2 2 2 4
Random Order (Height)
1.00 3
1.10
1.20
1.30 9
1.40
1.50 6 2 6 9 4 7
1.60 6 2 3 2 0 0 8 2 5 3 2 0 8 0
1.70 1 2 2 0 5 7 3 4 7 4 6 0
1.80 0 0
1.90 0
Data arranged in Numeric Order (Weight)
1
2
3 2 8
4 0 2 2 2 2 5 5 7 8 8
5 0 0 0 0 1 1 2 5 6 7 8 9 9 9
6
7
Data arranged in Numeric Order (Height)
1.00 3
1.10
1.20
1.30 9
1.40
1.50 2 4 6 7 9 9
1.60 0 0 0 0 2 2 2 2 3 3 3 5 8 8
1.70 0 0 1 2 2 3 4 4 5 6 7 7
1.80 0 0
1.90 0
Sample 2
Introduction
I now want to compare the heights of pupils in years 10 and 11 to see which are the taller girls or boys.
Hypothesis
My Hypothesis is that:
“I would expect boys of this age to be generally taller than the girls”
Gathering Data
For this I used a “Systematic Sample”. I decided that I would choose 35 boys and girls each at regular intervals from the alphabetical list. To do this I will take every 5th girl and every 5th boy as they appear on the database (excluding any doubtful entries by substituting for the next girl or boy and continuing as usual).
Mixed Years 10 and 11 Boys
Mixed Years 10 and 11 Girls
Steam and Leaf Diagram
Mixed Year 10 and 11 Boys, Data arranged in Numeric Order (Weight)
1
2
3
4 0
5 0 0 4 4 6 6 6 6 6 7 8 9
6 0 0 0 2 3 3 6 6 8 8
7 0 1 2 2 2 2 2 3 5
8 0 0 2
Mixed Year 10 and 11 Boys, Data arranged in Numeric Order (Height)
1.10
1.20
1.30
1.40
1.50 4 8
1.60 2 2 5 5 5 6 7 7 8 8
1.70 0 1 2 3 4 5 5 5 7
1.80 0 0 0 0 1 5 5 6 6 8
1.90 0 1 4
2.00 0
Mixed Year 10 and 11 Girls Data arranged in Numeric Order (Weight)
1
2
3 8 8
4 2 2 4 5 5 5 8 8 8 8
5 0 0 0 0 0 3 4 4 4 5 5 5 6 6 6 8 8 9 9
6 0 0 0 0
Mixed Year 10 and 11 Girls, Data arranged in Numeric Order (Height)
1.10
1.20
1.30 3 6
1.40 7
1.50 2 3 5
1.60 0 0 0 1 2 2 2 3 5 5 6 8 8 8 8 8 9 9
1.70 3 5 5 6 8
1.80 0 0 0
Cumulative Frequency Diagram (See Cumulative Frequency diagrams for Sample 2)
A “Cumulative (continuous) frequency” diagram will help me find the lower quartile, upper quartile and range. It also shows how the cumulative frequency changes as the data values increase.
Year 10 and 11 boys Height (m)
Year 10 and 11 Girls Height (m)
Year 10 and 11 boys Weight (Kg)
Year 10 and 11 Girls Weight (Kg)
Lower Quartile, Median, Upper Quartile and Inter Quartile range
For my 35 pupils in each case I will work out the following:
The median = 35 + 1 = 36 = 18th value
- 2
Lower Quartile = 35 + 1 = 36 = 9th value
4 4
Upper Quartile = 3(35+1) = 3x36 = 27th value
4 4
Inter Quartile Range = UQ _ LQ
Value Value
Box and Whisker plots (See Box and Whisker Plots for Sample 2)
Box and Whisker plots will help me compare my two sets of data (boys and girls), and this will clearly show the difference. I have drawn two diagrams, one to compare the weight between boys and girls, and the other to compare the height.
Evaluation
I think my project has gone quite well, and I have fulfilled my aims, to prove correct hypothesis. But although my sample was large enough to come to a reasonable conclusion, as to whether my hypotheses were correct or incorrect, for my results to have been more foolproof, I think I should have had a larger sample, perhaps 100 pupils altogether, with 50 of either sex.
Because I need a stratified sample, to keep my pupil sample fair, the only way I can get more pupils in the higher year is to increase my total sample. So this was one of my limitations, that I did not have a big another sample to provide full proof results. I don't think there was any bias in my results, because my sample was random, so there can't have been any bias. I think my plan was very effective, because I went through it in order, and completed all of my graphs and calculations that I needed.
One of my other limitations was grouping my data, because I grouped my data, which meant that answers and graphs only show the estimates or give estimated values. So to improve my project, I could have done standard deviation for the height data, with the data ungrouped. So If I did the calculations with ungrouped data, my results would be more accurate.
Further Developments
To further my investigation I can do the following:
- Take a larger stratified sample, but in order to do this I need more data.
- Investigate other things which affect the weight and height of a pupil e.g. IQ.
- Use a more wide spread data sample, which will contain Pupils from other year groups.
To further my work, I could investigate other things which effect height and weight such as whether the pupil was left handed or right handed, and their IQ.