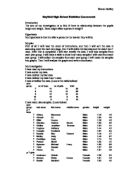
I have used secondary data provided by the Mayfield high data sheet because it would be time consuming to collect primary data and then stratify it. Stratifying the data and screening for outliers should ensure this data is useable.
To prove my first hypothesis I will take all of my stratified data and plot it as a scatter graph using autograph.
Plotting these points on a scatter graph is useful because it shows each individual pupil and gives a full analysis of the data. After plotting all my data on the graph I will be able to pick off any outliers and replace them with more reasonable data.
After I have re-plotted the graph with data that doesn’t have any outliers I can find the centroid and plot a line of best fit on the graph. A line going diagonally up and right will indicate a positive correlation proving my hypothesis to be correct.
To prove my second hypothesis I will plot the height and weight data of years 7, 9 and 11 on separate scatter graphs. The movement of the main body of points on the different graphs should indicate a change in height and weight therefore proving that as age increases so does height and weight however the graphs may not make the change in height and weight very clear so I will plot a centroid on the graph using the autograph tool. The change in the position of the centroid will clearly show the effect age had on height and weight.
To further back up my hypothesis I will plot the height and weight data as box plots by year. These box plots will be useful as another way of displaying the data and will be a much clearer way of displaying the data graphically.
Finally I will compare the lines of best fit on the three graphs for height and weight for year 7, 9 and 11. The gradients of the lines can be compared and will provide further evidence to suggest that my hypothesis is correct because the steeper the gradient the more the students weigh and the taller they are.
To prove my third and final hypothesis I will plot the data of boy’s weights in years 7, 9 and 11 on three separate graphs and do the same for the weight and height of girls in the same year. I can then compare these graphs to prove my hypothesis correct.
I will then produce box plots for the height and weight of boys and girls in each year and compare these giving me a clearer visual representation of how they compare through the years.
Finally I will use stem and leaf diagrams to back up my other evidence to prove my hypothesis correct. These will hopefully show the spread of weight and height throughout the different years.
The above graphs show the relationship between height and weight for years 7, 9 and 11. I have plotted these graphs to try and prove that as the age of the students increases so will the height and weight therefore proving my second hypothesis to be correct.
These graphs do show that as age increases so does height and weight because as the years increase the main body of points moves up the graph and along showing that weight and height has increased.
My second hypothesis is also proved by the fact that the centroid on each graph increases with age. In year seven the centroid was at 1.52 metres high and 44 in weight, in year 9 the centroid had moved to 1.59 metres high and at a weight of 49 and for the year eleven data the centroid was at 1.7 metres by 60. The position of the centroid gives us a good indication of the average height and weight because it is the middle value.
Comparing the gradients of the graphs also backs up the hypothesis as they can clearly be seen increasing with age.
The largest increase in height and weight was between year nine and year eleven. This is clearly visible from looking at the difference in the position of the bulk of points on both graphs and the difference in gradients. This radical change in height and weight between these two years could be because between the ages of 13 to 16 is when most teenagers reach puberty and therefore develop much faster than normal gaining height and weight.
These box plots further illustrate the progressive increase in height and weight between the years. The main box shows the main body of students with the central line being the median. In both the graphs the main body clearly progresses along the graph as the years increase indicating an increase in weight/ height as I predicted.
The mean values also help to show the steady increase in height and weight as age increases.
The extremes of the box plots show the span of data and in the box plots to show height these also seems to steadily progress indicating that all the student gained in height however in the box plots to show weight the box plot for year 11 appears to be an exception to this rule because the length of the left extremity indicates that there is a child who weighs drastically less than would be expected. This could be due to extreme weight loss by the child or could be caused by an outlier that was not noticed in the original graph.
The above diagram compares the lines of best fit in the three graphs of height against weight. Comparing these lines clearly shows a steady increase in the gradient and therefore an increase in height and weight. The line of best fit for year seven has a gradient of 20.5 kg/m, the gradient for the year 9 line of best fit is 30 kg/m and finally the gradient for the year 11 line of best fit is a hugely increased 78 kg/m.
Shown in table form makes it clearer to see how drastic the change in gradient is between years 9 and 11 and this further backs up my hypothesis that height and weight increase with age and that the increase in height and weight mainly happens between the ages of 13 and 16 due to puberty.
The year seven graph does not pass through the origin of the graph this is not clear from the above diagram but it can be explained by the fact that as we decrease in years we would gradually see that the line of best fit would pass through the centre because at one point in out lives we have had no height and no weight and so this would be depicted in the graph.
These two graphs show height against weight for year 7 girls and boys. Comparing these graphs back to back shows that there is very little difference in the gradient of the two graphs indicating that girls are similar in weight and height than boys. This disagrees with my hypothesis and the below box and whisker graph backs this up.
This set of box and whisker diagrams further disproves my hypothesis that girls will weigh less than boys. In these diagrams the maximum weight of both boxes is very similar and the box for boys has a lower minimum weight showing that boys actually weigh less than girls in year seven. The mean values also show that on average year 7 girls weigh more than year seven boys however there are many explanations for this and further diagrams may still prove my hypothesis to be correct.
The above graphs represent data that more closely supports my hypothesis because the boys clearly weigh more than the girls however I know from the previous graphs that the graph comparing girl’s height and weight is inaccurate or incorrect because it is highly unlikely that the girls would change so dramatically to alter the line of best so much however this could be due to growth patterns and an increased pressure on girls to lose weight.
The inaccurateness of the girls graph could have been cause by incorrect plotting or human error.
This set of box and whisker graphs gives a much more accurate and informative representation of the data and further backs up my hypothesis that girls weigh less than boys.
These two box and whisker plots show that boys weigh more than girls because the median boys weight is higher than the girls median weight shown by the line in the centre
of the box. The maximum weight is also much larger for boys than for girls this is shown by the span of the male box diagram.
These graphs show that boys have overtaken the girls in height and weight because the gradient on the boys graph is much steeper and the body of points is much higher up the graph.
This graph is the best graph to use to prove that my hypothesis was correct because the boys have clearly overtaken the girls in height and weight.
The box and whisker diagrams below further backs up my theory.
This graph shows just how much the boys have overtaken the girls in weight. The graph clearly shows that the median weight of boys is almost 15 kg more than girls and the heaviest boy is 23 kg heavier than the heaviest girl and this completely proves my third hypothesis.
The final step in showing my hypothesis to be correct is to use stem and leaf diagrams of weight for the three years and comparing them.
This stem and leaf diagram accurately shows that the girls weighed more than the boys in year seven. This is shown by the fact that there were more numbers after the number 5 for the girls indicating more girls weighed in the 50 kg range than boys.
This diagram shows how boys start to overtake the girls in weight in year nine because more of the numbers on the boys side are further down indicating a larger weight.
This final diagram shows the full transformation and reversal of the distribution of weight clearly showing how the boys have overtaken the girls in weight therefore proving my hypothesis to be correct.
This investigation has proved to be a success and all my hypothesis were proved correct. Using the data from such a large school made sure the data was fair and stratifying the data was successful in bringing down the sample size to a useable amount whilst keeping it fair however there were some areas of the investigation that could have been improved.
Using different schools from other areas could have an effect on the data because Mayfield high school may have been in an unusually affluent area meaning that the children are more likely to eat well or from a less affluent area where food is generally unhealthier.
Also because the data was secondary there could be some anomalous data because it was not directly recorded by me this could have had a minor effect on my investigation.