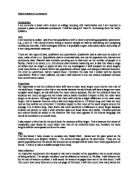
Ensuring that the sample members are selected at random is not the only requirement of a good sample. The sample size is also important - not much information can be obtained from a small sample, of three for example and it would be impractical to use a sample size of five hundred. I will use a sample size of fifty words per population therefore 100 in total. I think that this will be an ideal size to base my conclusions on.
When Ihave collected my sample Iwill organise the data into a frequency table this is to see if any trends are visible and it will make it easier for me to then transfer this information into a spreadsheet database. Whilst the data is in a spreadsheet package Iwill be able, with the aid of cell calculations, to check the accuracy of my calculations of the mean and variance from both samples. I will have the fields, x, f, x² fx and fx².
Precautions and Assumptions
When choosing the words for my sample I may encounter a problem. I have chosen to investigate word length it may in fact be difficult to actually establish how long a word really is. This may be the case for words which are abbreviated i.e “don't” is this a four letter word (dont), five letters (do not) or a two letter and three letter word? If this is the case I will simply exclude the current word and randomly, with my calculator select another word from the same line.
When Ido all my calculation especially for the mean and standard deviation Imust always keep to two decimal places. I must not round up/down beyond this limit, this is because Iexpect that there will be a small difference between the mean lengths of words between the adult and children's book, if Iround up/down too much this may make my results inaccurate.
When Icompare the two samples Ineed to consider the fact that Imay not be able to have decimal places as it is impossible to have one tenth of a word for example.
Raw data
Please find on seperate sheet the raw (unorganized) data . It shows the fivety randomly selected words with the page number, line number and word length for the two books. As Isuspected there are duplicates of certain word lengths and so Ihave converted the information into a frequency tables as it is easier to view.
Organizeddata
Please find on a separate sheet my spreadsheet containing my organized and grouped data.
Calculations
Notation Used
Mean
x = Σx
n
The mathematical average of a range of numbers (calculated by dividing the sum total of all the items in the range by the total number of items in the range).
Variance
s²= Σx²-x²
n
A measure of dispersion of a set of data points around their mean value. The mathematical expectation of the squared deviations from the mean. The square root of the variance is the standard deviation.
With my sample Iam now able to calculate the mean and standard deviation of both categories. As described above the mean is simply the sum of the total word lengths divided by the size of the sample:
adult book x = 282 = 5.64
50
Child book x = 245 = 4.90
50
Using these means Ican now calculate the standard deviation of each sample; as described above the variance is a measurement used to show the dispersal of numbers around the mean. The standard deviation is simply the squared root of the variance.
Adult book
s²= Σfx²-x² = (1874/50) – 5.64² = 5.67 s= 2.38
Σf
Children book
s²= Σfx²-x² = (1463/50) – 4.90² = 5.25 s= 2.29
Σf
Now that Ihave calculated the mean and standard deviations by hand Iwill use formulae in a spreadsheet package to double check the accuracies. The spreadsheet shows the organized data. To add up all of the values for any given column Isimply typed in a cell “SUM(C1:C12)” and the computer will automatically add up all of the values from cell c1 to c12.. As you can see from the spreadsheet the formula used to calculate the mean is the total “fx” column divided by the total “f” column. For the variance Idivided the sum of “fx²” column by the total of the “f” column subtracted by the mean². I have given my results correct to two decimal places for improved accuracy rather than just one. Using these formulas in a spreadsheet package was very quick and accurate it also illiminated human error, i.e mistype in the calculator, whilst calculating by hand.
Confidence interval
μx = X +/- Z Ơx
A confidence interval is an interval used to estimate the likely size of a population parameter. It gives an estimated range of values (calculated from a given set of sample data) that has a specified probability of containing the parameter being estimated. Most commonly used are the 95% and 99% confidence intervals that have 0.95 and 0.99 probabilities respectively of containing the parameter. The width of the confidence interval gives some indication about how uncertain we are about the unknown population parameter. Confidence intervals provide a range of plausible values for the unknown parameter.
I will use my value for the sample mean and standard deviation previously calculated to obtain two confidence intervals for each sample. I do not know what the population variance/ standard deviation is. Therefore Iwill need to use the value obtained from my sample standard deviation and find what is called an unbiased estimate for the population variance. This is found by using the formula:
s.e. = n s² : Where s² is the sample variance
(n-1)
The standard error of the mean. The standard deviation divided by the square root of the number of data values. The extent to which we expect the sample mean to differ (+/-) from the population mean. The more data we have, the smaller this range becomes. The standard error will make the confidence free from bias as we replace the variance with the standard error. I will have to calculate the standard error for my samples.
Population Sample
μ = ? n = 50
Ơ² = 5.786 (x)= 5.64
Ơ = 2.405 s = 2.38 BIAS
s² = 5.67 BIAS
Ơ²n-1 = (n/n-1) s² = (50/49)5.67 = 5.786
Ơx=Ơ/n = 2.405/root50 = 0.340
μ(x) = μ
Central Limit theorem
Z=X-μx or Z=X-μ
Ơx Ơ
The central limit theorem demonstrates that in large enough samples, the distribution of a sample mean approximates to a normal curve, amazingly, regardless of the shape of the distribution from which it is sampled. The larger the value of the sample size (n) the better the approximation to the normal. I think that it is safe to say that a sample size of fifty would satisfy this theory, therefore the following calculations are valid.
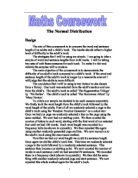
Normal Distribution
Most of the values are near the mean, which is in the middle, and the distribution is roughly symmetrical. It is often described as being “bell shaped”.There is infact a suitable mathematical model to describe this. This approach is pursued first by considering a method of standerdising the data and then making the area under each histogram independent of the total frequency. A standardized data set has a mean of 0 and a standard deviation of 1.
Suppose a data set has mean μ and standard deviation s. the standardized value of an observation x is z, where +/- z =(x)-μ(x)
Ơ(x)
When a data set has been standardized, the particular Normal curve which models the data takes a number of important properties. The normal curve for standardized data is called the standard normal curve. The area under the whole curve is equal to 1. Therefore as Iam calculating a confidence interval of 99% this will be converted to a probability of 0.99.
(z)= 2.5758
(-z) = - 2.5758
+/- z =(x)-μ(x)
Ơ(x)
+/- z Ơx = μx
μ(x) = (X) +/- Z Ơ(x)
μ(x) = 5.64 +/-2.5758 x 0.340
μ(x) = 4.76
or = 6.52
μ(x) = [4.76,6.52]
What this result means is that Ican be 99% confident that the population parameters are within this range. I think that is is safe to say that my rounding up of results to two decimal places does not have a detrimental effect on the overall results, as Iam talking about word lengths and you cannot have 0.76 of a word for example.
Please see on separate sheets the rest of the confidence intervals, these include 95% confidence for the adult book and the confidence intervals for the children's book (99% and 95%).
These are the results for the two confidence intervals for my two samples:
The confidence intervals have been represented graphically to portray any trends or relationships. As you can see for both the 99% and 95% confidence intervals the two intervals overlap one another significantly. This means that there is no real relationship between the the mean word length of the adult and children's book. Therefore there is no evidence to suggest my hypothesis (adult books will contain a larger mean word length than a children's one) is true. There are many possible reasons for this. Also Isuggested that maybe the adult book will have a greater variance than that of the children's book but again as my graphs and calculations show show this is not true. I calculated the unbiased estimated of the population variance above. This was unbias and provided me with the following information: the adult book had a word length with a variance of 5.357 letters whereas the children's book had a variance of 5.786 letters, as Isay the decimal points are not needed so the variance for both books are 6 words therefore there is no what so ever evidenece to support my second hypothesis. I will now explain possible reasons why my hypothesis was not supported and how I could imporve the statistical investiagtion.
Firstly was my hypothesis sensible, how many words are there in the English language that have over seven letters? Even so these are very rarely used, escpecially in a fiction book as they would often be out of context. Therefore most of the words that are used in the English language are most commonly in the three to six letter range, there is little variation. I think that this showed in my results as the frequency graph show a larger bulk between 3-6 letters. I think that if Idid my calculations with very large decimal points maybe a little relationship would be shown between the word length of an adult and a children's book.
When i collected my sample i did it in the most random way that was physically possible in the time available. I think that the technique used was generally good. I recorded the number of pages by flicking to the back of the book and seeing what the last page number was. To record the number of lines and number of words on any one line i randomly selected a page and simply counted the number of each, but this may not have been consistent throughout the whole book. Therefore slight inaccuracies may have been caused by this technique of random sampling, but considering the time allowance and limited acces to resources i think that the technique used is valid. I would no way try to improve the investiagtion by increasing the sample size because i feel that a size of 50 is sufficent. 20 would be far too small and 200 would be impracticle.i have worked out on separate sheets what the sample size would need to be for 99% and 95% confidence intevals for both samples. I have found out that for a 99% confidence interval of the adults book is 50 words and for a 95% only 46 samples are needed therefore my sample size was sufficient for the confidence needed to deduce accurate conclusions.
Would the length of words between an adult and children's book be a good indication on authorship? Maybe if i were to extend my statistical investigation i would investigate whether there is a stronger relationship between the number of words in a sentence of an adult book and a children's book. I would expect to find that the adult book will have a larger mean sentence length than the children's considering the attention span of children and the consistant use of pictures in a children's book.
Another way of extending this investigation to see whether it is possible to gain information about authorship of a text using statistical measures. I would investigate whether there are more columns within a story form a broadsheeet newspaper (the independent) and a telegraph (The sun). This is because it is proven that a more intellegent more mature reader tends to read the broadsheet oppsed to the telegraph and as the audiences are different maybe the length of stories/(number of columns) are different.
There has been research carried out that shows J.K Rowling the author of the collection of books called “Harry Potter”, has sold the millions of the great copies of her books. As extra work i could investigate why this is. I could compare the word lengths maybe with a not so succesfull author maybe S.B Chapman who infamously wrote “Fog”. I could see if it is possible to gain information about authorship of a text using statistical measures. Maybe J.K Rowling's books have more words on a sentence than that of the less famous author.