Ranges
In my experiment I have used 10 wire lengths ranges they start from 10 and go up to a 100cm in steps f 10cm. I used 10 ranges to make my results more precise and accurate so that my graph would be plotted accurately so that I can plot a line of best fit.
Reliable and accurate
To make my results reliable and accurate I could have measure the length of
the wire using a ruler I have to keep the temperature of the wire the same so that I can get similar results. To make the results accurate I have to use the same equipment as I did before and use the same type of metal with the same thickness of it so that I get accurate results. And I will also calculate my four sets of results for the resistance at each length and then divide them by four to give me a average and more accurate results.
Preliminary work
Preliminary work is the work that is done beforehand for you to know that the values of the different apparatus you are going to use. It is a way for the person carrying out the experiment to know that it has been set up correctly for when the actual experiment begins.
For my preliminary work, I set up the experiment as said in my method and took some readings. It helped me realise any mistakes that I was making that would affect the real experiment. These were things such as turning the voltage too high, which would be quite dangerous and could have burnt the wire or the laboratory unit. I also took the readings from the ammeter and the voltmeter too quickly and did not let the value settle before taking it. This would only make a marginal difference to the results by accuracy is the main part of any investigation and I wanted mine t be as accurate and reliable as possible so I will have to be a bit more patient when taking down results in the actual experiment. I also need to ensure (although it was not too much of a problem in the preliminary method) that the crocodile clips are at exact points on the wire i.e. 10cm or 50 cm to make readings more reliable and exact Another thing I noticed was I would have to watch out for what was the independent variables and keeping things like temperature and voltage constant. However, temperature will naturally increase as the voltage is being out through the wire so that is one factor that I can’t do much to control.
I also did the experiment using Nichrome wire, which is a poor conductor. This is because I thought that using a good conductor would make the wire too hot and the readings very high so I used Nichrome and found that my results were within a good range.
Prediction
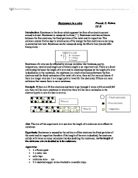
The four factors that affect the resistance of the wire are firstly the temperature is a factor. If the wire is heated, the atoms will move around more because there will be an increase in energy. This will cause more collision in between the atoms and the electrons. The increase in the collision will cause the resistance to rise. Also increasing the temperature of the wire makes the positive ion vibrate. This makes it harder for the electrons to pass through the increasing resistance.
= positive ions
e- = electrons
Secondly the thickness of the wire is a factor. This will cause resistance to decrease because of the increase in space in the wire. The increase in space means that there is more space for the electrons to flow freely because there will be fewer collisions with the atoms.
As the length doubles the resistance doubles. The thickness is also proportional to the resistance, (double the thickness the resistance halves).
0.38 mm
1mm
Thirdly, the material used would be a factor. If the material being used contains atoms with a large number of electrons on the outer shells, then this means there are more electrons available. So, in theory, if the material
have a large number of atoms there should be less resistance, because of the higher number of electrons. If the atoms in the wire are closely packed, then this will cause an increase in resistance due to the frequent collisions.
When a metal has free moving electrons it is a good conductor and has a low resistance.
- Copper and gold are good conductors so they have a low resistance.
- Nichrome is a bad conductor but has a high resistance.
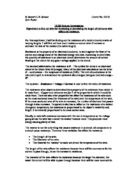
Finally, the length of the wire is a factor. The longer the wire, the longer it will take electrons to get to the end of the wire. This is because there will be more collisions between electrons and atoms so, in the theory, the length of the wire should be directly proportional to the resistance.
As the length doubles the resistance doubles as it is proportional.
The greater number of ions there is the longer it will take for the electrons to move through them.
50cm
100cm
I predict that as the length of the wire increases the resistance of the wire will also increase in proportion to the length. I think this is because the longer the wire the more atoms are present and so the more likely the electrons are going to collide with the atoms. So if the length is doubled the resistance should also double. This is because if the length is doubled the numbers of atoms will also double resulting in twice the number of collision slowing the electron down and increasing the resistance. Along with this the voltage will increase and the current will decrease.
Pre-test results
Obtaining evidence
Method
Step 1: You are given 100cm length of a Nichrome wire which has a diameter of 0.38mm. First you have to set up the equipment correctly as told.
Step 2: Once this has been done place the probes 100 apart and measure the voltage using a voltmeter.
Step 3: Then measure the current using an ammeter.
Step 4: Using both the voltmeter and the ammeter measure the voltage and current at the following ranges 90, 80, 70, 60, 50, 40, 30, 20, 10 and 0
Centimetres apart.
Step 5: Repeat this experiment 4 times and calculate the resistance at each
Length using this formula.
R = V/I
R =Resistance V = voltage I = Current
I will repeat this experiment four times; this will enable me to highlight any anomalies. These anomalies will be removed from the average and be plotted on a graph with the line of best fit. I will do this by following this simple method.
Replication
Results table 1
Replication
Results table 2
Replication
Results table 3
Replication
Results table 4
Results averages of resistance only
These are the averages of the resistance of the Nichrome wire experiment I added the four results first and then divided them by four and then plotted them on a graph with the line of best fit.
I have been quite accurate in my experiment I took my measurements at different ranges and I used the correct apparatus for the experiment.
Analysis
My results show that when the length of the wire increases the resistance also increases and the voltage also increases but at the same time the current decreases.
This is the same comment I have in my prediction so this proves that I was right
My graph shows a increasing level of resistance as the length increases so if the length is doubled the resistance is doubled too.
I don’t have any dodgy results because I was really accurate and I used this accuracy through out this experiment.
Conclusion
From my results, I have come to the conclusion that if you increase the length of a wire, you increase the resistance of it as well. Ht resistance of Nichrome wire at 2 0hms increases at proportion to the length. I think that this was because of an increase in the amount of atoms in the wire at each ascending length and if so there were more atoms (that were moving with a lot of energy from the voltage across them) then there would be many collisions between them and the electrons thus causing a lot of electrical friction hence resistance, and three Ohms I think that the resistance was
even higher than 2 Ohms because the atoms had even more energy thus they vibrated even more. This resulted in further collisions with electrons and so even higher resistance.
My graphs also show clearly that as the length of the wire increases the resistance also increases and gives a NE direction straight line.
Linking prediction to conclusion:
My original prediction was that increasing the length of a wire would increase the resistance along with it the voltage will increase and the current will decrease. And, from my results, I can see that this is true because on a 2 Ohms wire the resistance is less than the wire which is 3 Ohms because at 20 cm of length the resistance is 2.5 Ohms and at 40 cm the resistance is 4.8 and this proves that my prediction was correct because the resistance has increased as the length increases.
Evaluation
I think that this experiment has been a very successful one as my results supported my prediction. My results were particularly accurate as the experiment was repeated 4 times measuring the voltage and current then from these results I calculated my resistance and then to find the averages of my resistance for each length I added all four results of the first length and divided them by four.
There were no strange results (anomalies) within my results table and I think this was because of the extreme caution and care that I put into making sure that the experiment was set up correctly with careful measuring of the length and many other reasons too.
However I think that I could have repeated my results more times however for the reason that I feel although the experiment was repeated four times, the most accurate results can only come from constant repeatability which I did not display in my experiment but then I think that repeating four times was enough. I also wanted my experiment to be repeated a couple of times more but then again I did not have enough time to do this so this could be a improvement I could do the next time I do this experiment. I would repeat the results further for even more accurate and reliable results. I would also take even more caution when recording the values as although I did my best to turn off the power supply at this time, delaying even for a half of a minute would increase the temperature of the wire and thus make the next set of results not as accurate as the last one. This was very important as temperature was one of the possible variables that I wanted to keep constant so that I feel that I could’ve taken more care and been more aware of when I was recording the values that the power pack was definitely off.
I believe that I could’ve improved the method by making it more specific. I stated clearly all the various method I took in the setting the experiment up but I could have been more specific to how the apparatus was used and perhaps why I used the apparatus.
I believe that I did get a suitable range of results for this experiment. I recorded results from length ranging from 10cm-100cm. I think that this is a very good range to use and from this range you could clearly see any trends in my results. One could say however that I could have recorded the lengths at 15, 20, 25, and 30cm and so on to make my range of results even better and accurate. However, I feel that my range of results was good enough to be able to confirm a pattern in my results, as I certainly believe that my range of results was a good one. Perhaps I could have tried the temperature at even higher voltages for more results but I feel that this
was not possible with the time allocated and was quite difficult with the temperature factor meaning results will not always be accurate.
Some other areas in the experiment that I feel that I could have improved on were factors like controlling the temperature because although it is difficult, it is a very important factor that can ruin results if not controlled. Measuring the lengths of a wire can also be an inaccuracy that could be improved, as the rulers used are not exact, and it is difficult to get an accurate reading of length by eye, as the wire might not be completely straight, it may be a different thickness throughout the length. These would have contributed as well to the error. These results would be difficult to improve on as they are reasonably accurate, and there were no anomalous results.
Nevertheless, if I were to do this experiment again, I would use newer, more accurate ammeters and voltmeters, a more accurate method of measurement, and take a much wider range of readings, and more readings so that a more accurate average can be taken.
Overall, this investigation has been a very successful one. I feel my results and analysis have been as accurate and reliable as they could have been under the time allocated circumstances. However I feel with extra time, I could have repeated the experiment and made it even more accurate and precise and adapted it to try it to other variables. These would be things like investigating the effect of cross sectional area or temperature of resistance of a wire.