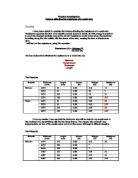
Nichrome wire of diameter 0.274mm has very similar values, which may only vary due to experimental error. This would be a good option but the voltage for 300cm (3m) exceeds the maximum voltage available. To find out the maximum voltage, I multiplied the maximum voltage per cell (1.5V) by three because of the number of cells present within the battery. (Therefore, 3 x 1.5V = 4.5V). I am multiplying it by three because I think that the length of the wire is directly proportional to the resistance. I then multiplied the voltage for current 100mA and length 100cm by three because I will use up to 3m (300cm) of wire in our experiment (3 x 1.90V = 5.7V). Unfortunately, because this wire exceeds the maximum voltage available, this wire cannot be used in the experiment.
Copper wire has a low resistance, therefore, voltages are too difficult to read, which is why this type of wire shall not be used in this experiment.
Nichrome wire of diameter 0.457mm is the better of the three wires to use because the values are clearer to read. There is a smaller resistance and it does not exceed the maximum voltage (3 x 0.85V = 2.55V).
I shall use Nichrome wire of diameter 0.457mm for this experiment. The temperature will remain constant so this cannot affect experimental values of the resistance. I will maintain the temperature by using a low current and I using lengths of wire above 20cm to prevent the wire from overheating.
The maximum length of wire available for use is 3m (300cm). I shall use lengths 40cm, 80cm, 120cm, 160cm, 200cm, 240cm, and 280cm. This covers the majority of the wire length. I have chosen seven values because when the average resistance is plotted on the graph, it is more accurate and clearer to read.
I shall measure the voltage, and then calculate resistance, for each current three times in case any anomalies appear. Should there be an anomaly, I will take the average of just two values and exclude the anomaly.
I will use digital multimeters to read the voltage and current because they are more accurate and easier to read off values. It is also very easy to alter the range to change the degree of accuracy.
The range of the ammeter is 200 mA and will show current with sensitivity up to 0.1 mA. The range of the voltmeter is 20 V will show potential difference with sensitivity up to 0.01 V. The lengths of the wire shall be measured to accuracy 0.1 cm (1 mm).
I will use the same equipment in the real experiment as in the trials, which is as follows.
-
A battery consisting of 3 cells
- 2 multimeters (one for use as an ammeter, one for use as a voltmeter)
- Nichrome wire of diameter 0.457mm
- Crocodile clips
The currents I will use are 20mA, 60mA and 100mA because they are still fairly low values and they are equidistant.
I predict that that the resistance will increase as the length of the wires also increases. For example, using the figures from my trials, if the length is 300cm and the current is 100mA, then the resistance will be 2.55Ω, three times the resistance for a wire of length 100cm with a current of 100mA (0.85Ω).
In my last experiment, I found out that the resistance is directly proportional to the number of identical resistors in series so from this knowledge, I believe that the length of the wire will be directly proportional to the resistance.
Resistance in conductors is caused by vibrating ions and if the length of the conductor is doubled, so the amount of vibrating ions in the electrons way also doubles. If the number of vibrating ions in the way of the electrons increases, the resistance also increases proportionally so I believe this to be true to the resistance of metal wires.
I also know that by sliding the contact on the rheostat, I can change the number of coils, through which current may flow, changing the total resistance. Therefore, the total resistance must be proportional to the number of coils. The more coils used, the higher the resistance.
Obtaining Evidence.
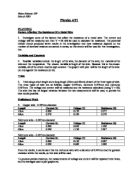
A table of resistances and voltages for Nichrome wire of diameter 0.457mm
Above are the results of my experiment. The values are fairly close together with the exception of the highlighted one.
Analysing and Considering Evidence.
My graph is a straight line through the origin showing that the resistance is directly proportional to the length. For example, if I see for 80cm that the resistance is 5.7 Ω, then I would expect the resistance to be twice as much for 160cm because it is directly proportional. The true value is 10.47Ω but this is due to experimental error. As the length of the wire increases, the total resistance also increases linearly.
Ohm’s Law (V=I x R) applies provided that the temperature remains constant. This is also the case because the current in a series circuit is the same throughout the circuit.
My conclusion supports my prediction that the total resistance is directly proportional to the length of wire.
This conclusion is true for up to 3m of Nichrome wire of diameter 0.457mm but I think it should also be true for other wires of different lengths and resistances, providing they are kept at a constant temperature.
Remembering that Ohm’s law applies only when the temperature is kept constant, the currents used in this experiment cannot exceed the maximum value of the current, set by the maximum power rating of the conductors.
I know that by sliding the contact on the rheostat, I can change the number of coils, through which current may flow, changing the total resistance. Therefore, the total resistance must be proportional to the number of coils. The more coils used, the higher the resistance.
Evaluation.
I was happy with my experiment because my readings were, on average, easy to take although occasionally the ammeter flickered because it was too sensitive. If I did this experiment again, I could change the range to sensitivity 1mA. The ruler had a good range because it was used to measure up to 1mm. I found the crocodile clips difficult to use because they were wide and can have different amounts of contact with the wire. A variable resistor was used as a potential divider to cover all possible voltages.
The voltages in my table hardly ever reached over 2V so if I carried out this experiment again, I would prefer to use a range of sensitivity 2V for more accuracy.
This experiment could be carried out using data-logging to both speed it up and to give more accuracy. I could also use different wires to see if my conclusion is true for other types of metal wires.
The points plotted on my graph were very close to my line of best fit, proving that the length of wire and the average resistance are directly proportional.
There was one anomaly within my results, which I have highlighted. When the reading was taken, the wires were touching, causing it to short-circuit. Next time, for more accurate results, I would make sure the wires were not touching.
For greater reliability, I could do more repeats, although I think if I did do more repeats, they would be very similar to those I have already taken.
I think my evidence is sufficient to support a firm conclusion that resistance is directly proportional to the length of a metal wire.