- A Power Pack
- Some Crocodile Clips
- A Ruler
- A Piece Of Wire
- A Micrometer Screw Gauge
- An Ammeter
- A Voltmeter
Plan:
In this investigation a simple circuit will be set up to read the voltage and current when the length of the wire changes. The length will range from 10cm - 90cm with intervals of 10cm. The length of the wire will be changed, by moving the crocodile clip across the wire on a ruler. I will also use a Micrometer Screw Gauge to check the thickness of the wire. If we use a piece of wire that is not the same thickness all the way along, it could affect our results.
I also did preliminary tests to ensure that the wire did not get too hot, and what current to use in the circuit. This is important, as the current must be the same on every test to make it fair. I will also test each different length, three times to make it fair.
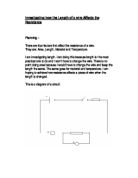
This is what the circuit will look like:
The circuit should be set up as in the circuit diagram. It is important that the voltmeter is set up in parallel and the ammeter in series. The readings from the ammeter and voltmeter will be used to work out the resistance. This can be done using the formula:
V=IxR
Where V=voltage, I=current and R=resistance. This can be rearranged into:
This means that I can find and record the resistance.
Fair Test:
To ensure that the investigation is carried out in a fair way and that the results will be accurate and reliable a number of things must be followed. The only variable in the test will be the length of the wire. The same circuit and battery must be used throughout as different batteries may have different voltages if they are old. The experiment should be repeated 3 times, and an average taken to make sure that the results are reliable. I will also keep the current at 1 amp on every test so the wire stays the same temperature. This will also make it easier when calculating the resistance using the voltage and current. During preliminary tests, I found out that the wire was 0.37 mm all the way along.
Results:
These results prove part of my hypothesis correct as the longer the length of wire, the more resistance it had, but the results were not directionally proportional as I predicted, as the line of best fit does not pass through (0,0).
Analysis:
The results from the graph give a clear indication of how the resistance compares to the wire length. There is a very strong positive correlation. This means that when the length of the wire increases, the resistance also increases.
The theory behind this is explained in the prediction. In any given metal wire, there are a number of atoms and free moving electrons. Electricity is the movement of these electrons through the wire. Resistance is caused when the free electrons moving through the wire collide with the atoms making their path through the wire more difficult. This means that if there are more atoms in the way to collide with the free electrons the resistance is increased.
The results that I have obtained, partly support my original prediction. This is because in the prediction I said that as the wire length increased, the resistance should increase. However, the results were not directionally proportional as I predicted.
The line of best fit clearly shows that the results followed the expected pattern very well. The points are very close if not touching the line and there are no anomalous results.
Evaluation:
By conducting this experiment, I have found out the following:
- The longer a piece of wire, the more resistance it has.
- The thicker a piece of wire, the more resistance it has.
- The hotter a piece of wire, the more resistance it has.
To make the experiment better, I could:
- Take more results, to make it more accurate.
- Take more acute results such as using more decimal places in my readings.
- Use the same equipment for every reading.
- Use more lengths.
- Used different graphs to show my results
Thank you for reading my coursework.