In this experiment we have to determine the water potential of potato tissue. Water potential equals to solute potential because pressure potential is zero. This is because there is no pressure added or taken away in this experiment; pressure does not vary in this experiment as we are leaving it natural.
Therefore we do not need to use the formula above for this reaction we will only need to find solute potential which will equal to water potential.
Water potential (W) = Solute potential ( S)
In a free standing solution there is no pressure potential (Ψ p =0), so the water potential of the solution is equal to the solute potential of the solution. At equilibrium, the water potential of the tissue is equal to the water potential of the solution.
Before carrying out the real investigation I needed to look at some variables that needed to be controlled and then decide on the best situations to use.
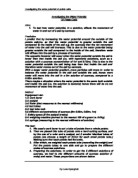
I had two options for the shape of the potato sample that I would be using; a cylinder or a cuboid. To create a cylindrical shape, I used a cork borer and a knife to cut the cylinder down to the length that I wanted it to be. To create the cuboids, I used the knife and judge purely by eye how exact the shape was, I then cut down the length of the cuboid by using a ruler.
I decided that using cylinders of potato would be the best shape as with the cork borers I can be assured that the diameter of the samples will always be the same if I use the
same cork borer each time. However, with the cuboids, it is much harder to regiment the size and shape as it is almost all done by eye. Therefore, each sample of potato would not be exactly the same size and so would not have the same surface area, this would affect the experiment as osmosis would be allowed to occur at a grater rate in those samples with a larger surface area.
There was a choice of using Petri dishes, boiling tubes or glass beakers. I decided that Petri dishes were unsuitable as a lot of solution is needed in order to submerge the potato samples, also it would be very difficult to ensure that the potato samples did not come into contact with the surface of the Petri dishes.
The glass beakers were also unsuitable as to fully submerge the potato samples, there would once again be a need for large amounts of solution.
I decided to use boiling tubes as it is possible to fully submerge all of the samples and keep them from touching the sides of the boiling tube. There is also a far easier method to stop any of the solution from evaporating out of the boiling tubes than there is with the other two types of glass wear; bungs.
In order to maximize the surface area of all of the potato samples I would need to prevent the potatoes from touching the sides of the boiling tube wherever possible, as this would affect the rate of osmosis.
I decided to place each potato sample on a spike and then suspend the samples by placing the spike into the bung. This means that all of the potato samples will be suspended in the solution, without having to touch the sides of the boiling tubes and so the surface area available for osmosis to occur is maximised.
As there was a limited number of boiling tubes that could be used per student (5), I decided to try out different lengths of potato samples to see which would fit best into the boiling tubes as I had to ensure that 3 samples would be able to fit comfortably into each boiling tube. I found that 1cm long potato samples were best as they were able to fit on the spike with enough spacing between each sample to allow for any gain in size of the samples, without allowing the samples to touch each other and so decrease their surface area.
I found that 20cm³ would suffice in covering all three of the potato samples fully and would allow for any gain in size of the samples, so that they would still remain fully submerged. This also means that there is plenty of solution to allow for optimum osmosis to occur within the potato samples.
It will be difficult to accurately measure the change in length and diameter of the potato samples during this experiment, so I will have to measure the change in mass of each sample by using a top pan balance. In order to obtain a wide range of results, I will use five concentrations of sucrose solution, from 0.0M to 0.8M at 0.2M intervals. To ensure the reliability of my results, I will immerse 3 cylinders of potato in each concentration.
The mass of each cylinder will be measured before and after the experiment, and the mass of each group of three cylinders will be averaged. The same process will be repeated after the experiment. I will calculate the percentage change in mass from the average mass before and after the experiment for each of the concentrations.
When the potato cylinders are removed from the boiling tubes at the end of the experiment, some of the sucrose solution they have been immersed in will remain on the surface of the potato. If the mass of these cylinders is then measured without removing the excess sucrose solution, the results will not be accurate and reliable as the mass will be greater than what it should be. Paper towels must be used to dry each cylinder of potato before the mass is measured.
The apparatus that I will be using in this experiment are as follows:
- boiling tubes
- 500ml beakers
- stop clock
- 1 potato – all potato samples shall be taken from the same potato, so the
samples will be as similar as possible.
- knife
- cutting tile
- paper towels
- cork borer
- ruler
- boiling tubes
- distilled water
- bungs
- boiling tube rack
- 1M sucrose solution
- graduated pipettes
- pipette filler
- spikes
There are no safety risks within this experiment, and so there is no need for protective gloves or safety spectacles as no dangerous chemicals are used. However, as with all practical experiments, the area should be kept as tidy and clean as possible.
I will need to make up my own sucrose solutions with different concentrations. In order to do this I will need to look at a table that will show me how to create the solutions properly.
Table to show dilutions for different sucrose solutions.
Method
- Make up 20cm³ of each of the five concentrations of sucrose solution that will be used. Use a graduated pipette in order to do this and the dilution table and place the solutions into boiling tubes. Making sure to mark the boiling tubes so that it is obvious what concentrations are in which boiling tubes.
- Using the cork borer, get some cylindrical samples of the potato. Then using the ruler and knife, on the cutting tile, cut off any skin that is on the potato (as this will affect the rate of osmosis that may occur in these samples) and cut down the potato cylinders to 1cm in length, using the ruler so that there are 15 samples.
- Carefully wash the potato samples with distilled water to remove any of the starch that is on the surface of the samples, then remove any excess moisture from the surface of the samples by using paper towels. When the potato samples are weighed their mass will be greater than their true values as some water may have been left on the surface.
- Weigh each of the 15 potato samples and record their mass before the experiment begins.
- Place 3 cylinders of potato onto one each of the five spikes, leaving a space between them all so that there is room for them to grow in size, making sure that it is obvious which potato samples is which.
- Skewer each of the spikes onto the middle of a bung so that the samples can be suspended in the solutions in this way. Make a note of the time at which the samples were placed in the solutions.
- Leave for at least 2 hours so that osmosis has been given enough time to occur to a reasonable extent.
- Remove all of the samples from the solutions, making sure that you still know which samples are which.
- Remove any excess solution from the surface of the samples by blotting the samples with a paper towel. As the solution will affect the mass reading that will be obtained.
- Zero the top pan balances before taking a reading of the mass for each of the samples, so that the readings that are taken are accurate.
- Weigh and record the mass of each of the potato samples, then record them against the appropriate ‘before’ mass.
By having three samples of potato in each of the concentrations, I will be able to find an average mass of the potato samples for each of the concentrations. This will also allow for any anomalies within my experiments and so make my results more reliable.
Apart from the concentrations of the sucrose solutions that I will be using, there are many other variables that I must consider within this experiment, which could affect the results that I obtain. Therefore, I must control them in order to make my results as accurate as possible. Controlling these factors will help to ensure that my experiment is as fair a test as possible.
Accuracy and precision of equipment used:
- Stop-watch: this read the time correct to the nearest milli-second.
- Ruler: this measures correct to the nearest 0.5mm
- 10cm³ graduated pipette: this reads correct to the nearest 0.5cm³
- Top pan balance: this reads to the nearest 0.01g
None of the equipment that I will be using will allow my measurements to be 100% accurate. However, as the same equipment will be used for all samples, these inaccuracies and loss of precision will not affect the investigation greatly.
Table to show variables that I will be controlling, measuring and varying within this experiment.
When there is a lower concentration of sucrose solution outside the potato cells, the water molecules will enter the potato cells by osmosis, and cause them to become turgid. This is more likely to happen when there is a low concentration sucrose solution outside the potato cells because the water potential will be higher outside the potato cells. Thus, when the sucrose solution is low in concentration, there will be a percentage gain in mass of the potato, and it will become firm/turgid.
When there is a higher concentration of sucrose solution outside the potato cells, the water molecules will leave the potato cells by osmosis, causing them to become flaccid, and possibly plasmolysed.
This is more likely to happen when there is a high concentration sucrose solution outside the potato cells because the water potential will be lower outside the potato cells. Therefore, when the sucrose solution is high in concentration, there will be a percentage loss in mass of the potato, and it will become soft/flaccid.
I predict that as the concentration of sucrose solution increases, the percentage change in mass of the potato will decrease. This is because as the concentration of sucrose solution increases; the solute potential increases, decreasing the water potential of the solution, therefore decreasing the amount of water molecules that will move by osmosis into the potato cells as their tendency to move has been decreased.
Obtaining results.
Table to show mass of potato samples before and after and the average mass recorded at the start and end, in different sucrose solutions.
= anomalous results
Table to show the average change in mass and the percentage mass change of the potato samples in different concentrations of sucrose solutions.
Graphs
The graph that shows ‘percentage change in mass’ plotted against the ‘concentration of sucrose solution’ shows that as the concentration of the sucrose solutions increases, the percentage change in mass moves from highly positive to highly negative.
This is in line with my prediction that in distilled water and low concentrations of sucrose solution, the mass of the potato samples would increase as water would enter the cells by osmosis. This is due to the water potential of the solutions being greater than that of the water potential within the cells, meaning that the tendency of the water molecules to move is greater for those in the solutions. Therefore causing the water molecules to move into the potato cells by osmosis.
From looking at the first graph, I found the molarity of the sucrose solution at which there would be no percentage change in mass of the potato samples. This is the point where the line of best fit crosses the x axis on the graph. This is the point at which there would be no gain or loss in mass of the potato samples. Therefore, this point is the point where the water potential of the potato cell is equal to the water potential of the solution that it is in. The molarity of this point was 0.33 M.
This means that the solute potential within the solution and the cells are also equal, due to the following equation:
Water potential (W) = Solute potential ( S)
I then cross referenced the molarity of the sucrose solution at which there would be no percentage change in mass with the second graph. From this graph I was able to find the solute potential of the potato cells; -937.5 kPa.
As water potential is the measure of the tendency of the water molecules to move, this must mean that the tendencies of the water molecules to move are in equilibrium. Thus the net movement of the water molecules is zero between the cells and the solution. So this water potential is the water potential of the potato cells and therefore the water potential of the potato cells is -937.5 kPa.
Evaluation
I think that on the whole my results were quite accurate and therefore quite reliable. This is as on the whole the results are fairly consistent with each other, my results followed the trend that I predicted before I started investigation.
Table to show the sources of error within this investigation, how they affected the results and how they could be avoided or improved on.
I believe that the main source of error was the sucrose solutions not having been mixed thoroughly to give the same molarity throughout the each solution. I believe this probably occurred due to me being in a hurry to make up all of the solutions for the experiment.
Also as the sucrose molecules (solute) is denser than the water molecules they may have been in higher concentrations towards the bottom of the boiling tubes, meaning that this area of the solution would have been more concentrated with solute molecules than the rest of the solution. This would mean that the water potential of the solutions at the bottom of the
boiling tube would have been greater than the water potential nearer the top end of the boiling tube. Even if the difference in water potential was very small, this would still have affected the osmosis that would have occurred within the sample/s that were in the lower regions of the solution. As the water potential in the lower regions would have been lower than the water potential in the higher regions, this would mean that the volume of water entering the potato samples in the lower regions would have been lower compared to the volume of water molecules entering the samples in the higher regions.
I believe that this is the main cause for the mass reading I obtained for the 0.4M sucrose solution that was anomalous. Whereas in the other repeats, both of the potato samples decreased in mass, the anomalous sample increased in mass. I feel that this could be the possible reason why this anomaly occurred.
If I were to repeat this investigation again, I would carry out even more repeats for each of the sucrose solutions, in order to get data that is as close together as possible. By repeating the experiments many times, the results obtained are more likely to be accurate and so reliable than. Most or even all of the results should be very close to one another, any that are not close are therefore anomalous and can be seen very clearly as they will not follow the pattern that the other results will have. By doing this, I will get lower standard deviations for all of my results, meaning that my results are more accurate than the ones that were obtained when only two repeats were carried out.
To extend this investigation further I could investigate the water potential of other types of potato, also I could look at the water potential of other types of plant cells, such as carrot cells, onion cells etc. I could analyse the water potentials and trends that occur in each of these plant cells and compare them to one another.
I could also, do the same investigation again, only with a different set of sucrose solution concentrations, or more concentrations (e.g. 10, instead of 5). This would give me more data and so I would be able to see more clearly whether my results to this investigation were truly correct.
Bibliography
-
- used to find scientific knowledge for the introduction
-
- used to find scientific knowledge for the introduction
- ‘Water movement by osmosis’ class handout sheet – used to find scientific knowledge for the introduction
- Biology class notes – used to find scientific knowledge for the introduction, dilutions for the sucrose solutions and the calibration graph (‘solute potential’ against ‘concentration of sucrose solution’)
- Biology 1, Cambridge – used to find scientific knowledge in introduction and for Variables table.
- Statistics 1, MEI structured mathematics – to find the equation for standard deviation.