These concentrations will be made up in 6 test tubes using a 20ml syringe for adding the water and 5ml syringe for adding the sucrose.
- Next I will weigh each potato piece I have cut using a balance.
- I will now place one piece of potato to each test tube for a period of 20 minutes.
- Once 20 minutes have passed I will remove the potatoes from the test tubes and lightly dry them using a piece of tissue paper. This will be done by gently wiping the potatoes on the tissue paper. This is to remove water not taken in by the cells of the potato.
- I will then weigh each potato piece again and record this in a table. I will then be able to calculate the percentage change in mass.
- I will then repeat the experiment twice to account for any experiment inaccuracy and to identify any anomalous results.
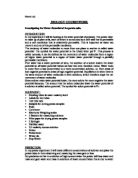
Scientific Prediction
As I stated earlier, and have seen from my preliminary work, I predict that the mass of the potato will decrease most when the sucrose concentration is highest- i.e. when the water potential is smallest. I also predict that when the concentration of the sucrose solution is 0%-i.e. the water potential is greatest; the potato will increase in mass.
Osmosis is the passive net movement of water from a high water potential to a low water potential across a semi-permeable membrane. This process can be sped up by several factors, including temperature, pressure and the water potential gradient.
The potato strip originally contains a certain amount of water in its cells. Potatoes are storage cells which are packed with cellulose, so for this reason I predict the potato will have a low water potential. When it is placed in a solution of a different water potential, water moves either into or out of its cells to create an osmotic balance. As a result the potato can become turgid- meaning its cell membrane is pushing out against the cell wall due to much water having entered its cells, or it may become plasmolysed- the cell membrane shrinks away from the cell wall due to the volume of the cell decreasing (i.e. water moving out of the cell).
When the potato is placed in distilled water, there is a water potential difference between the cell and the surrounding solution. As a result water moves down the water potential gradient and enters the cell in order to create an osmotic balance. This is shown in the diagram below.
Distilled Water (in test tube) Potato Cells
Key
Net movement of water
Water molecule
Solute
Partially Permeable Membrane
As you can see in the diagram above, there are more water molecules in the test tube than in the potato cells. As stated earlier osmosis is the net movement of water from a high water potential to a low water potential. It is therefore clear that water molecules will move from the left side of the diagram to the right- i.e. from the test tube to the potato until there is an osmotic balance. This is why I predict the potato will increase in mass when the potato is immersed in pure water. I predict this will continue to happen until the potato is immersed in a sucrose concentration, which has a lower water potential than itself. This is when water will start to move out of the cells of the potato and the potato will therefore lose mass.
Eventually the cells in the potato will become turgid, and at this point very little water will move into the potato. The diagram below shows the structure the cell will have at this point.
Diagram showing the appearance of a plant cell when it is turgid
The diagram shows that all the cell membrane is in contact with the cell wall, which is what a turgid cell looks like. It is therefore clear how the cell becomes turgid, in that the cell membrane pushes out against the cell wall to allow more water into the cell. However due to the cell wall, the cell would eventually stop taking in water, as the membrane can move no further out. The effect is like blowing up a balloon in a box. When the balloon takes in so much air that it is all touching the sides of the box, the box exerts pressure on the balloon, and so it becomes increasingly difficult to blow the balloon up any further. This same thing applies to water entering the cell, and is the reason why plant cells to not burst when they become turgid, but animal cells do (as they lack a cell wall).
For these reasons I think the cell will become more turgid when the water potential of the sucrose solution is greater than the water potential in the potato. I predict the mass of the potato will increase most when the water potential gradient is steepest. The less negative the water potential is, which the potato is immersed in, the faster the potato will uptake water, and therefore increase in mass.
I must now consider what will happen when the water potential of the potato is greater than the water potential of the sucrose solution.
When the potato is immersed in a solution of lower water potential than its own cells, water moves out of the cells by osmosis. The solute potential will be higher in the sucrose solution than the cells of the potato, so therefore the water potential of the solution is lower. This means the water potential is more negative in the sucrose solution than that of the potato so water will move out of the potatoes and into the solution.
Potato Cells Sucrose Solution
The diagram above illustrates the point I have just made in that there is higher water potential in the potato than there is in the sucrose solution. This means the water potential is less negative in the potato than it is in the sucrose solution, so water must move out of the potato to form an osmotic balance. The solute (sucrose) in the sucrose solution lowers the water potential, making it more negative, which causes the water potential gradient between the potato and the solution to be steeper.
For this reason I believe that increasing the solute potential will cause the mass of the potato to decrease. The higher the solute potential the steeper the water potential gradient, and therefore the faster water will move out of the potato. For this reason I believe that the mass of the potato will decrease most when the sucrose concentration is highest.
For the reasons specified I predict my graph will look like the following or will portray a similar trend- i.e. as sucrose concentration increases, percentage change in mass of the potato decreases. As well as this my preliminary results which I have explained above show this.
Percentage Change in Mass
(%)
Solute Concentration
I think the graph will look like this for several reasons. When the solute potential is 0 or only slightly negative, the potato will have a lower water potential than the solution so water will move into the potato. The cells will then become turgid. At this point the cells will no longer be able to take in water, which is why the line is curve and not a straight line. When the solute potential becomes greater than the cells of the potato, water will move out of the potato and into the solution, causing it to become plasmolysed. However once all the water has left the cell no more water will be able to move out, and therefore the mass of the potato will not change. This is why the graph levels off. Where the line intersects the x axis, this is when there is no change in mass. The potato and solution have equal water potential so there is no net movement of water- i.e. insipient plasmolysis. At this point the cells will appear like the one below
Safety
To ensure my experiment is safe I will make sure that I don’t drop any potato pieces on the floor which could be a potential hazard for someone to slip on. I will also take extra care when using the knife to skin and cut the potato. I will also wear safety spectacles to protect my eyes.
Strategy
The table above shows why I have chosen to use some apparatus as oppose to others. The apparatus I am generally using will be more accurate than using another sort, which will therefore make the experiment more accurate.
Table showing the percentage change in mass of potato strips when they are placed in solutions of different water potentials
Indicates an anomalous result
Analysis
From my results I can see that increasing the solute potential, and therefore decreasing the water potential, causes the percentage change in mass of the potato to decrease. This can basically be explained in that immersing a potato strip in a solution with a lower water potential than itself causes water to move out of the potato in order to create an osmotic balance. For this reason the potato decreases in mass
These results agree with my prediction in that the potato decreases in mass once the water potential of the solution it is in becomes less than its own water potential. In my prediction I claimed that when this occurred water must move out of the cell to create an osmotic balance.
From my graph it is clear that when the sucrose potential of the solution is less than the sucrose potential of the potato, and therefore the potato has a lower potential, the potato chip increases in mass- i.e. when the sucrose concentration is less than 0.3M. Above this concentration, however, the potato has a lower sucrose concentration than the solution and water must therefore move out of the potato.
The processed evidence also supports the fact that the percentage change in mass of the potato is not a linear relationship with the sucrose concentration. This can be seen in that my graph curves off at both ends. This proves the fact that only a certain volume of water can be taken into the cells before the cell wall exerts such a pressure that no more can be taken in. When the sucrose potential was high the water only lost a certain amount of water before it could not lose anymore. Both these conclusions agree with what my results indicate.
From the graph I can now also determine what the water potential of the potato was. Using a sheet handed out by the teacher showing a graph relating sucrose concentration and water potential at those various concentrations I can find out what the water potential of my potato was. Where the line intersects the x axis indicates when there is no net movement of water between the potato and the solution it is in. Here the cells are in the incipient plasmolysis change. Due to the fact that there is no net movement of water at this point, it can be said that the two have equal water potential. Therefore I can say that the sucrose concentration of my potato pieces was 0.2625M. Using the graph handed out by the teacher I can now read off from the graph what the water potential is for this solute concentration.
After reading off the graph I have found the water potential of my potato pieces to be -714kPa. Using my graph for the results I have obtained I can calculate the rate of reactions (osmosis) at various sucrose concentrations.
From the processed evidence I can see that percentage change in mass does relate to the concentration of the solution the potatoes are immersed in. The graph clearly shows this in that the general trend is percentage change in mass decreases as the sucrose concentration increases.
The graph shows that my prediction is true, in that osmosis has limitations and that placing a cell in a very low water potential solution will force water out of the cell and vice versa. Likewise the cell can only lose or gain a certain amount of water which is also shown in the graph when the best fit line curves off. The graph shows that when the solution becomes a lower water potential than the cell, only a small amount of water leaves the cell. This can be seen in that when the percentage change in mass of the potato is negative the line quickly curves off. However when the potato is placed in a solution which has a higher water potential than itself it readily gains water. This also proves my prediction in that potatoes store large quantities of sucrose. It all ready only contains a small amount of water so can only lose a small amount of water. It can however gain much water. All these conclusions are consistent with my processed evidence.
Solution Potato
Net movement of water
Water molecule
Sucrose
Partially Permeable Membrane
The diagram above can be used to explain my processed evidence. The graph shows a high percentage change in mass when the sucrose concentration is low. This is illustrated in the diagram above. Naturally water must move out of the solution to form the osmotic balance which explains the increase in mass of the potato.
When the concentration of the sucrose solution increases, the percentage change in mass of the potato is lessened, which can clearly be identified on the graph. The science behind this is that the rate of osmosis is dependant on the water potential gradient. As the sucrose concentration in the solution increases the potato and solutions’ water potential gradient becomes shallower, causing water to move across the cell membrane at a slower rate.
The graph shows that at 0.263M sucrose concentration the line intersects the x axis. This can be explained in that here there is no net movement of water. As a result the potato does not change in mass. Here incipient plasmolysis is taking place.
The graph then shows that increasing the concentration further causes the potato to decrease in mass. This is simply due to the fact that the potato now has a higher water potential than the solution so water must move out of the potato. Eventually sucrose concentration has no effect on osmosis, which can be seen with the graph levelling off. This occurs because there is no more water in the cells for the potato to lose.
The graph relating water potential and sucrose concentration also shows that increasing the solute potential decreases the water potential.
Water Potential = Solute Potential + Pressure Potential
The equation above shows that increasing the solute potential or pressure potential will cause the water potential to increase. This can be seen in the handout graph showing sucrose concentration against water potential.
I can therefore deduce that a very low solute potential, or one which is less than the potato, causes the percentage change in mass to increase. The cells take in water by osmosis in order to reach an osmotic balance (incipient plasmolysis) and this causes the mass to increase. However at some point the uptake of water in a plant cell will decrease and eventually stop due to the pressure potential factor exerted on the cell wall by the protoplast. This occurs in order to prevent the cell from bursting, which is not so in an animal cell.
I can also deduce that a high solute potential, or one which is greater than the potato, causes the percentage change in mass of the potato do decrease. This, again, occurs due to water leaving the cell to create an osmotic balance. The protoplast ends up shrinking away from the cell wall and therefore pressure potential at this point is zero.
Finally I can deduce that at one specific solute potential there is no percentage change in mass of the potato. At this point there is an equilibrium reached between the cells and the solution around them. At this point the pressure potential has just reached zero. For my experiment this occurred when the sucrose concentration was approximately 0.26M, which when read from the graph gave my potato a water potential of -714kPa.
Evaluation
Overall I think my experiment went very well. I managed to find out what the water potential was of my potato piece, which means my procedure was suitable. I obtained only two anomalous results which also indicates my experiment was carried out accurately.
During the experiment there were a few things which made the experiment inaccurate. Drying off the excess water from the potatoes was probably the biggest problem I faced as the potato pieces would be dried by different amounts. This therefore means that the experiment is not truly a fair test.
The equipment I used during my experiment was quite accurate and overall only gave me a small percentage error. I used appropriate sized syringes for extracting volumes of solution as to reduce the error margin I would obtain. The balance also read to 2 decimal places so offered a low percentage error. I believe therefore that the main cause of my anomalous results was due to drying off the excess solution from the potato.
The biggest limitation to my procedure was drying the excess water from the potato. I believe this because in doing so I dried up different volumes of water from each potato piece. This would therefore have a large effect when I would calculate my percentage change in mass.
The second biggest limitation to my procedure would probably be making up the concentrations. Whilst doing this it is very easy to draw up slightly too much solution which would therefore cause my results to be inaccurate and lead to anomalous results.
To improve this experiment I would have used larger pieces of potatoes.
Percentage error = (error / reading) x 100
The above equation shows how percentage error is calculated. I therefore believe that increasing the size of potato would decrease the percentage error. For example if we consider weighing the potatoes then it is clear that dividing by a larger number gives us a smaller error. This is shown below in an example
Mass of potato in this example = 5g
Therefore percentage error = (0.005 / 5) x 100
= 0.1%
This is still a very small percentage error but can easily be reduced by using a heavier potato
Mass of potato in this example = 20g
Therefore percentage error = (0.005 / 20) x 100
= 0.025%
Therefore simply doing this will greatly reduce the inaccuracy in this experiment.
However despite all this I think that my results are very reliable as they are how I predicted them to be and I am able to explain them using scientific knowledge. I only obtained two anomalous results also. The equipment I used was also fairly accurate and would be difficult to improve it.
Diagram taken from Biology 1 Advanced Sciences