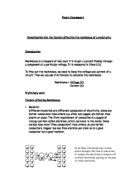
The range of measurements I will be taking will range from 100cm to 10cm, after taking a result off the ammeter and voltmeter at each length, I will calculate the resistance to present the graph of my results.
Fair Test:
To ensure my tests are completed fairly, I will keep all variables constant, except the one that I am investigating (e.g., I will keep the wire the same width and same metal), I will do all the experiments on the same day to ensure the conditions in which the tests are taken are all as similar as possible
To make my experiment reliable, I will take several sets of results and figure out the mean average and base my graph and final results from that.
Safety:
To make sure the experiment is carried out in safest possible way, the apparatus will need to be switched off when not in use to make sure it doesn’t over heat, and touching any apparatus that may get hot should be avoided. All loose clothing should be tucked in and long hair tied back.
Results:
Set One
Length Of Wire(cm) Voltage (V) Current (I) Resistance(ohms)
10 0.1 0.45 0.2
20 0.2 0.44 0.5
30 0.24 0.43 0.6
40 0.35 0.41 0.9
50 0.39 0.4 1
60 0.49 0.39 1.3
70 0.52 0.37 1.4
80 0.59 0.37 1.6
90 0.68 0.35 1.9
100 0.7 0.28 2.5
Set Two
Length Of Wire(cm) Voltage (V) Current (I) Resistance(ohms)
10 0.16 0.44 0.4
20 0.15 0.44 0.3
30 0.25 0.43 0.6
40 0.32 0.41 0.8
50 0.47 0.39 1.2
60 0.5 0.38 1.3
70 0.52 0.38 1.4
80 0.58 0.37 1.6
90 0.64 0.36 1.8
100 0.7 0.35 2
I took two sets of results when conducting my experiment so I could take the resistance from each and use this to find the average resistance, giving me a more accurate picture.
Average Resistance:
Length of Wire(cm) Resistance(ohms)
10 0.3
20 0.4
30 0.6
40 0.85
50 1.1
60 1.3
70 1.4
80 1.6
90 1.85
100 2.25
Conclusion
I believe that my prediction is true as my graph displaying my results has a positive correlation, showing that as the length of the wire increases, so does the resistance, because the number of atoms is higher and therefore the free electrons can collide with them..
There is a consistent, easily recognisable relationship between the resistance and length of wire and this is shown in my graph, the results show an almost straight line which means that the resistance goes up steadily and is proportionate to the length of wire.
Evaluation
I think my experiments were quite accurate as I performed them fairly and properly, this is demonstrated by the good set of results that I have gained.
To try and improve my accuracy, I performed the experiment twice to get two sets of results, and could therefore find an average which would give me a better accuracy.
I don’t appear to have any outstanding anomalies that show up on my scatter diagram, only a minority of points don’t quite fit on my line of best fit and these are quite close to it anyway. These could have been caused by the temperature of the equipment rising or my measurements being slightly inaccurate.
I could have improved this experiment by performing it several more times to get a more fair average. I could have also used more accurate equipment but what I used was all that I had available to me. Another way I could have improved this investigation would have been to experiment with another thickness of wire and investigate the similarities/differences between the two.