This is a diagram to illustrate my prediction:
Have you tested your experiment? Do you need to change anything?
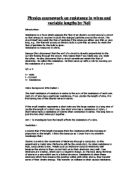
I have tried out a preliminary experiment to see what material, length of wire etc. I should use. I tried out different materials, lengths and thicknesses. Here are the results of the preliminary experiment.
After looking at these results, I have decided to use nichrome for the material as it didn’t get hot during the experiment. I have chosen it for this reason because I need the temperatures to stay roughly the same and not get too high otherwise this will affect the results. I have also decided to keep the length of the wires at one metre because it is easier to measure them with a metre ruler. My preliminary experiment has affected my planning because it has helped me to decide what material and length of the wires I should use. Also, when I come to do my actual experiment, it will be much quicker and easier for me to do because I know how to set it up and this will save time for me.
Obtaining
I have placed all me results and repeats into one table and I worked out the averages. I have measured the diameter of each wire using a micrometer. I measured each wire with this instrument three times and calculated the averages.
The results table is on the next page.
Analysis
What does your results table tell you?
My results table tells me that as the thickness of a wire increases, the resistance decreases. Similarly, as the thickness of the wire decreases, the resistance increases.
I have drawn a graph of the thickness of the wires against the resistance and I drew a line of best fit through the points.
What does your graph tell you?
If my graph had a straight line through the origin, it would mean that the resistance of a wire is directly proportional to the thickness. However, my results are not directly proportional as the graph is curved. The graph tells me that as the wire get thinner, the resistance increases and as the wire gets thicker, the resistance decreases. For instance, when the wire was 0.18mm thick, the resistance was 17.5ohms. when the wire was 0.52mm thick, the resistance was 3.3ohms.
Why does this happen
This diagram explains why the resistance increases when the wire becomes thinner and why it decreases when the wire becomes thicker.
The wire behaves like this because an electric current flows when negatively charged particles called ‘electrons’ move through a conductor. As the current flows, these electrons will collide with the ions in the wire. This makes it more difficult for the current to flow, and causes resistance. Electrons collide with ions more often in a thin wire than they do in a thick wire because the space is restricted in a thin wire. The more collisions there are, the higher the resistance. This is why the thinner the wire, the greater the resistance, and the thicker the wire, the lower the resistance.
Would drawing a different graph give you more information?
My first graph was not directly proportional, so it didn’t have a straight line. This is why I drew a graph of inverse proportionality so that I have more information to compare. I plotted the thickness of the wire against 1/Resistance. These are the calculations I did to work out the values. I obtained the cross-sectional area of the wire by using the formula r2. I did this by dividing the thickness of the wire by 2 (because it is the diameter).
After drawing this graph, I decided to do a more complex one by plotting the cross sectional area of the wire against 1/Resistance. I did this graph using the cross-sectional area because I wanted to have a better idea of how much space there is for the electrons to pass through.
This graph was also a straight line through the origin, and had anomalies like the other graphs. From this graph, I can see that as the cross sectional area of the wire doubles, the 1/Resistance of the wire doubles as well. For example, when the area is 0.05mm2, the 1/Resistance is 0.05 ohms. When the area is 0.1mm2, the 1/Resistance is 0.1 ohms.
How good are your results? Was your prediction correct?
My readings are fairly accurate and nearly all of them are within 10% of the averages. My prediction is correct because my graph and my results prove that as the thickness of the wire increases, the resistance decreases.
Evaluation
How well did your experiment work?
The experiment was easy to perform and the circuit was easy to set up. The ammeter and voltmeter were easy to read from as I have used the apparatus before, but I had to be careful when I took down the readings because I had to look at the meters directly.
Did you have any anomalous results? Were your results reliable?
i had two anomalous results on each graph. They are all identified as I have circled them and not included them in my line of best fit. My results were reliable because the repeated readings are close together.
What could have caused any anomalous results? How reliable were your results?
I think that the anomalous results could be down to human error. For instance, I might have read the meters wrong for one of the results because I wasn’t looking directly at it. Also, the wires could have heated up during the experiment which would have caused the anomalous results.
To show how reliable my results are, I have calculated the percentage difference of each repeat reading with the average. Here is a table of the results:
How could your method be improved?
To improve my method, I could use different types of meters because the ones I used weren’t very easy to read from as I had to be at eye-level. if I was to repeat the experiment, I would probably try out a digital resistance meter because it could possibly be more accurate than using an ammeter and voltmeter.
I used crocodile clips to connect the wires, which may have affected the results. This is because the clips may have come loose without me noticing and so the current wouldn’t be flowing through properly. I could use better connections next time.
Another factor that I could improve is measuring the length of the wire. This is because I didn’t do it very accurately this time as there might have been kinks in the wire when I lined it up to the metre ruler. This means that the wire could have been a little longer that I wanted it to be and it could have affected the results. Next time, I could use another method to measure the wires very accurately.
What other factors could you investigate to provide additional evidence for your conclusion?
I cannot think of another way to test the thickness factor, but I could test other factors for my conclusion. For instance, I could test how the length, material and temperature affect the resistance in a wire.
For the length, I could cut out a range of different lengths of wires, for example 20cm, 40cm, 60cm, 80cm and 1metre. I would keep the other variables constant though. I could then test the resistance in each wire and use the same method as I did for this experiment.
For the material, I could use a range of different materials including nichrome and constantan. I could then see how this will affect the resistance.
For the temperature, I could set the wires at different temperatures and record the resistances. I could compare them and see how this affects the resistance. This will be quite difficult to do though because it is quite hard to set the wires at specific temperatures and keep them there while I take down the readings.