However, even in components where Ohm’s Law is not obeyed, the resistance formula still applies.
When Resistance is Useful
Resistance wire is wire specially produced to provide resistance. The metal used to make the wire will not be a very good conductor of electricity (e.g nichrome), and the wire will be very thin and long. These wires work by changing the energy that charged particles that pass through them lose into heat energy. Kettles and hair-dryers contain coils of resistance wire in order to create heat which will enable them to fulfil their purpose.
Like resistance wires, resistors are created in order to provide resistance, and many resistors contain resistance wire. However, unlike resistance wires, resistors are used in electric circuits in order to ensure that the right amount of current gets to each component. Resistors vary enormously in their amounts of resistance. A rheostat is a variable resistor – with a sliding or rotating contact.
General Method of Investigation
I now began my experiment to investigate what factors affect the resistance of a wire. I carried out 2 experiments – one to investigate how the resistance of wires with different diameters will differ, and one testing the effect length has on resistance.
Apparatus
Ammeter – To measure the current flowing through the circuit..
Voltmeter – To measure the voltage across the wire.
Power Pack – To provide the current for the experiment.
Micrometer – To measure the diameters of the wires.
Ruler – To measure the length of the wires
Leads – To connect the components of the circuit
Wire cutter – To cut the wires to size
Wires of different sizes To be tested
Preliminary Experiment
Before starting the actual experiments, I had to do a preliminary experiment to determine what length the wire should be when I was testing diameters. A preliminary test was necessary because when I used the thickest wire at a potential difference of 12 v on the power pack, the resistance was so low that the electrical current did not register on the ammeter, which could only read up to 5 amps. At the time, the wire was 1m long. Had I made the wire longer, the current would have registered on the ammeter since there would have been more resistance. However, I did not wish to waste more wire than necessary, and also, the longer the wire was, the more difficult it was to work with. I therefore decided to leave the length of the wire at 1m and take the results only up to 10 volts on the power pack. I encountered a similar problem when I was doing the test on different lengths of wires because the resistance of the shortest wires was so low that, in one case, I could only record the results up to 6 volts on the power pack.
Precautions taken to ensure a fair test
- When I was testing the effect of one particular factor on the resistance of the wire, every other factor (e.g, temperature, material of wire) had to be kept constant.
- The same ammeter and voltmeter should be used for every test.
- The wire had always to be kept perfectly straight so that a short circuit would not be allowed to occur.
- For each length/diameter, a whole set of results (ranging from 2v to 12v on the power pack) should be taken, and an average of these results recorded in order to avoid any anomalous results.
- The power pack should be turned off after every result is recorded so that the wires are not allowed to heat up, thus making the test unfair, since there would be more resistance when the wire was hotter. This is also a safety precaution to prevent people getting burnt as would be the case if they touched the wire when a current was running through it.
Diagram
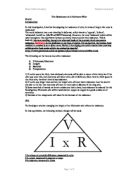
After doing the preliminary test as explained above and ensuring that my experiment was as fair as possible, I set up a circuit as shown in the diagram. I then recorded the voltage across the wire and the current flowing through the circuit and used the resistance formula R = V in order to find the resistance of the wire.
I
Prediction
As I said above, I will be carrying out two experiments to see how they affect the resistance of a wire: one varying the diameter of the wire and one varying the length of the wire (both times keeping every other factor, such as temperature, constant.)
I predict that a thick wire will have less resistance than a thin wire, and a long wire will have more resistance than a short wire. This is because of the reasons given above – i.e. it is harder for electricity to flow through a long, thin wire than a short thick one because there will be less space for it to flow through, and also more chance of it bumping into atoms – thus causing more resistance.
Experiment 1
Testing how the thickness of a wire affects its resistance
For this experiment, I used Constantan wire in a variety of diameters – ranging from SWG (Standard Wire Gauge) 32 – being the thinnest to SWG 24 – the thickest. I measured the diameters of the wire with a micrometer which could read up to 0.05 mm as opposed to a ruler, which only measures up to 0.5 mm. The wire was always 1m long.
Results
In order to make my results clear and understandable, I set them out in separate tables. I also produced line graphs of them to show the correlation between the average resistance of each wire compared with its diameter. I drew 3 different graphs illustrating the same thing because I knew that since the diameter of the wire and its resistance were inversely proportional, any graph I drew comparing them directly would be a curve. It is harder to read information off a curve than off a straight line graph. I therefore tried drawing the graphs comparing the resistance with something related to the diameter, such as its square, to see which graph would give me a straight line. I discovered that the inverse of the diameter squared gave me this (i.e 1)
D 2
SWG 32 – diameter 0.25 mm
SWG 30 – diameter 0.4 mm
SWG 28 – diameter 0.375 mm
SWG 24 – diameter 0.56 mm
Conclusion for Experiment 1
As predicted, those wires with larger diameters had less resistance than the thinner wires. The following table is a summary of the resistance of a wire compared to its diameter.
This is shown on the graphs on the following pages.
Some of my results are printed in italics. This is because these results are anomalous. For example, in my experiment of SWG 32 wire, my first result is 7.73 Ω. This is very low compared to my other results, and may have been so because the wire was cold and therefore had less resistance. On the next set of results, there is one that reads 6.39, which seems abnormally high. This is probably because the wire was now so hot that the resistance increased. I found that although my graph 1/D2 was a straight line, there was one anomalous result, namely 8.09. The average resistance for this diameter of wire should have been higher. It wasn’t because, as I explained above, one of the results was 7.73 Ω. This brought the average down. I also noticed another anomalous result for the SWG 24 wire – the average went up by 0.02 because one of the results was higher than the rest (2.12 Ω). I cannot explain this result, as it was the first in a series of results, and therefore, if anything, should have been lower than the rest, not higher.
I explained in my preliminary experiment that for the SWG 24 sized wire, I would only be able to measure the resistance up to 10 V on the power pack because for 12 V, the current would be so high that I would not be able to measure it on my ammeter – therefore, I would not be able to find out its resistance.
Experiment 2
Testing how the length of a wire affects its resistance
Again I used Constantan wire for this experiment. However, since I was testing how the length of the wire affected its resistance, that was the only factor I changed for this experiment. I used SWG 28 wire (d = 0.375 mm) for this experiment, and used wire ranging from 20 cm to 1 m. As opposed to the micrometer which I used to measure the diameters in Experiment 1, I used a metre ruler to measure the length of the wires in this experiment since the micrometer was not long enough to measure them. This probably introduced some error into the measurements.
20 cm wire
40 cm wire
60 cm wire
80 cm wire
1m wire
Conclusion for Experiment 2
My predictions were correct. The longer the wire was, the higher its resistance was. Below is a table showing resistance compared to length.
I did not get any anomalous results for this experiment. However, as I explained in my preliminary experiment, I would not be able to record the resistance for the higher voltages in the shorter wires because the current would be too large to register on my ammeter.
I also drew a graph for this experiment. However, drawing a graph this time was much easier than before because the length of a wire and its resistance are directly proportional, therefore a graph comparing them directly gives a straight line.
Evaluation
My graphs and results have shown that the resistance of a wire changes according to the area of its cross-section and its length. However, while resistance varies in direct proportion to length, the relationship between the area of the cross-section of the wire and resistance is inverse. That is to say that when area is doubled, resistance is halved, and vice versa. Therefore:
R ∝ 1
A
We know that to find the area in a circle we must use the formula A = πr2 . Since r (radius) is half of D (diameter), r2 = D2
4. As I measured the diameter of the wires as opposed to their radius, this formula would be easier to use in relation to my investigation.
The fact that r2 = D2 means that the area of a circle can also be written as
4 A = πD2
4
In this formula, π and the number ‘4’ are constants, and are therefore not relevant. For the purpose of my investigation it is consequently sufficient to say that A = D2.
We can now substitute D2 for A and write R ∝ 1 as R ∝ 1 , i.e. resistance can be
A D2
said to be proportional to the inverse square of the diameter of the wire. We can now rewrite this formula to say R = k
D2, where ‘k’ is a constant and therefore never changes.
We cannot say exactly what ‘k’ is because of human error in measuring the wire diameters but, by filling in the quantities R and D2 using information obtained in order to draw graph 2, we can work out an average. The first step is to rearrange the above formula to k = R x D2.
Therefore, k is approximately 0.57. We can check this by taking samples from Graph 2 to test with: 1. R = k / D2 = 0.57 / 0.15 = 3.8 (graph = 4.1)
2. D2 = k / R = 0.57 / 6.5 = 0.088 (graph = 0.075)
Although the results from the graph and from the formula are not exactly the same, they are very close. This proves that R is inversely proportional to area, and therefore to the square of the diameter of the wire, thus showing why graph 3 was the only one with a straight line of best fit which goes through (0,0), indicating proportionality.
Overall, my results proved to be quite accurate, and my predictions were correct. However, there were several anomalous results which might have been prevented had I carried out my experiments in a slightly different manner. This is shown in my graphs, where, although the lines were fairly straight, not all the points were plotted in a straight line.
In experiment 2 (comparing the resistance of wires of different lengths), some error was almost certainly introduced in the measuring of the wires. This is because:
- I used a metre ruler to measure the wires. This was not the most accurate device to use because it was hard to see exactly where the wire ended and it only measured up to approximately 0.5 of a millimetre; however it was all that I had access to.
- The wires themselves were hard to measure because they had many kinks and would keep bending back on themselves slightly.
Even though I used a micrometer, which is a fairly accurate measuring instrument, to measure the diameters of the wires used in experiment 1, I could not be absolutely sure of the diameter because of human error.
I used analogue devices (as opposed to digital devices, which are much more precise) to measure voltage and current. With analogue devices, it is necessary to judge by eye in order to read the measurement. This naturally leads to more human error, which would, in turn, reflect in my results when I worked out the resistance from the voltage and current. Of course, the best option would have been to use a multimeter which tells you the resistance of an object directly. However, there were none available, and therefore this alternative was not open to me.
Between the recording of each result, I turned the power pack off in order to try and keep the temperature constant and my results fair. However, it was inevitable that the wires would heat up a little while the power packs were on, especially as it took some time to read the results off the ammeter and voltmeter. One way to avoid this problem would have been to change the wire between each test. I did not do so because it would have been far too time consuming and wasteful.
Possible Extension
I mentioned at the beginning of my coursework that there are four factors which affect resistance – namely material, length, diameter and temperature. Of these, I only tested to see how length and diameter affected resistance. I could have extended my investigation in two ways:
- By testing wires made of different kinds of metals to see which metals are more resistant and which allow current to flow through them easily.
-
By changing the temperature of the wires I used to see how temperature would affect resistance. The problem with this would have been finding a way to vary the temperature of the wire. However, had I done this experiment, I would probably have found that hot wires offered more resistance than cooler ones.
Bibliography
Balanced Science 2 – Cambridge University Press – Jones, Jones, Marchington & Acaster
Science Through Diagrams – Oxford Revision Guides – George Bethell
Encyclopaedia Britannica (CD-ROM version)
A New Physics – D Bryant & D G Kershaw
Encyclopaedia Encarta