Predicted Results:
To predict the resistance in the wire with different lengths of wire, I will be using the following formula:
The letters in the formula stand for:
R= Resistance
L= Length of Nichrome Wire
P= Resistivity of Nichrome Wire
A= Area of 26 Swags of Nichrome Wire
The length of nichrome wire will change for each different calculation. The lengths I will be predicting for are: 0.2m, 0.4m, 0.6m, 0.8m and 1.0m.
The resistivity of Nichrome wire is 110 x 10-8
To calculate the area of the wire, the formula I will use is:
Πr2
It is given that the diameter of 26 swags of Nichrome wire is 0.45mm. As all the calculations and figures are in meters, I will have to convert the diameter from millimetres to meters, by dividing by 1000. So:
0.45 ÷ 1000 = 0.00045m
To get the radius, I will divide the diameter by 2, because the radius is half the diameter. So:
0.00045 ÷ 2 = 0.000225m
Now, to calculate the area:
Πr2 = Π x 0.0002252
= Π x 0.000000050625
= 0.000000159cm2
Formula to work out resistance =
L x (110 x 10-8)
0.000000159
0.2m = 0.2 x (110 x 10-8) ÷ 0.000000159 = 1.38 Ω
0.4m = 0.4 x (110 x 10-8) ÷ 0.000000159 = 2.77 Ω
0.6m = 0.6 x (110 x 10-8) ÷ 0.000000159 = 4.15 Ω
0.8m = 0.8 x (110 x 10-8) ÷ 0.000000159 = 5.53 Ω
1.0m = 1.0 x (110 x 10-8) ÷ 0.000000159 = 6.92 Ω
Prediction Continued:
I also predict that the resistance is directly proportionate to the length of the wire. If you double the length of nichrome wire, so will the resistance. From my predicted results, I can see that when I double the length from 0.2m to 0.4m, the resistance almost doubles too, from 1.38Ω to 2.77Ω. In the same way, if I triple the length of wore from 0.2m to 0.6m, the resistance is once again almost triple, from 1.38Ω to 4.15Ω. This also works if I quadruple the length of the wire from 0.2m to 0.8m and if I increase the length of wore 5 times, the resistance also increases in the same way. This can be seen not only when using 0.2m of wore but also if I double the length of wore from 0.4m to 0.8m, the resistance is almost double too, from 2.77Ω to 5.53Ω. This is because there is 2, 3, 4, or 5 times the length of wore, which means that there will also be 2, 3, 4, or 5 times more nichrome atoms present in the wire, this will mean that electrons will be having to pass through a lot more atoms, which will be more difficult for the electrons, and will also loose a lot more energy. Hence resulting in an increase of resistance.
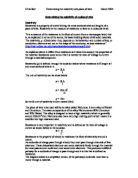
From my predicted results, I can predict the shape of my final graph. It will be going up in a positive correlation; as you increase the wire length, so will the resistance. The final graph will look something similar to the graph shown below:
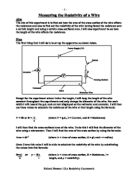
Method:
- Check all equipment is working correctly.
- Set out the equipment correctly.
- Measure out the length of wire you will be testing and mark out on the wooden board.
- Move crocodile clip along to the marked length, and tape down firmly.
- Switch on power pack and record readings on both multimeters, one as the current and the other as the voltage.
- Repeat the process another 3 times, so to be able to work out the average.
- Repeat the above steps 3- 6 for the other 4 lengths of wire.
Table of Results
Analysis:
Looking at my table of results, it clearly shows the relationship between the length of a wire and the resistance; as you increase the length of the wire so does the resistance.
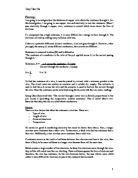
As I had predicted, the shape of my graph did go up in a positive correlation. As the length of the wire increased, the resistance in the wire also increased.
From my graph, and my results, I can see that as the length of wire increases, the resistance also increases. This is because as the length of wire increases, there are more atoms present in the wire. This makes it more likely for atoms and electrons to collide. As there are more atoms, the electrons will find it harder to travel through the wire. The more atoms present, the harder it will be for electrons to travel further. This will tire them out, as they will be losing energy faster, which results in an increase of resistance.
From my graph, I can tell that my predicted results were correct and so was my prediction. I had predicted that if the length of wire was doubled, the resistance would also double. When I doubled the length of wire from 0.2m to 0.4m, the resistance was almost double too. At 0.2m, the resistance was 1.42Ω and at 0.4m it was 2.78Ω. This was out by 0.06, therefore saying that my prediction was very much correct. I had also predicted that if the length was tripled, quadrupled or increased 5 times, so would the resistance. Looking at my graph, and the line of best fit, I can tell that the resistance and length of wire are directly proportionate because majority of the points land on the line of best fit, and if the line is extended, then it also runs through the origin.
As I had predicted the resistances for the different wire lengths before, I can now compare both sets of results to see how close I was when predicting my results.
Percentage Efficiency:
Formula to work out percentage efficiency:
Percentage Efficiency = Predicted Results ÷ Actual Results x 100
0.2m = 1.38 ÷ 1.42 x 100 = 97.2%
0.4m = 2.77 ÷ 2.78 x 100 = 99.6%
0.6m = 4.15 ÷ 4.18 x 100 = 99.3%
0.8m = 5.53 ÷ 5.54 x 100 = 99.8%
1.0m = 6.92 ÷ 7.06 x 100 = 98%
From the above figures, it is seen that my predicted results and actual outcomes were very close; the lowest was out by 2.8%, which is very good, and shows that my results are also very reliable. Overall, my results were 98.8% accurate.
Looking at the graph, where both the predicted and actual outcomes are plotted, it clearly shows that the differences between both the sets of results are very small. This shows that my results that I had predicted were also correct and my final results are reliable and accurate. Both sets of results go up in a positive correlation as predicted and prove the second part of my hypothesis that the resistance and length of wire are directly proportionate to each other- as one increases, so does the other.
Evaluation:
I think that the method I used for my investigation was good and suitable, because I had got very good and accurate results. Each time the experiment was repeated, the figures were very much the same. My results that I had predicted and my actual results were 98.8% accurate, which shows that my method was suitable.
When I did my investigation, I did not come across any anomalous results, again proving that I had a good and reliable method.
I think my method was suitable for my investigation. The experiment was very quick and straightforward, so my method went well with what I had to do. I think the best part of my method was that once my equipment was set out, I didn’t have to change anything, except where the crocodile clip was positioned at, as the length had to be changed because this was the variable I was testing. The hardest part was to get all the equipment to be working in order, and getting the wired and equipment in order. This was also very time- consuming.
I think I could have improved my method in the following ways, to make the investigation even better:
-
Check all equipment worked before hand- check ALL equipment, and not just wires and bulbs.
- Have the lengths of wire testing pre- marked, to save time later.
- Do the practical quicker; so that results were more accurate, because the longer the power-pack remained on, the temperature would increase, therefore increasing the resistance too. Also, the fuse could blow too.
- Use Selotape to secure the clip and wire together, as they would detach sometimes during the practical. By doing so, both will stay secure and time will not be wasted either.
- Know how and where to set up equipment before hand, so time is saved- know which power packs work and which don’t!
My results were very reliable and accurate too. Overall, my results were 98.8% accurate. I did a percentage efficiency test, to see how efficient and reliable my results were. I used the formula: PREDICTED OUTCOME ÷ ACTUAL OUTCOME x 100.
The results are shown below:
0.2m = 1.38 ÷ 1.42 x 100 = 97.2%
0.4m = 2.77 ÷ 2.78 x 100 = 99.6%
0.6m = 4.15 ÷ 4.18 x 100 = 99.3%
0.8m = 5.53 ÷ 5.54 x 100 = 99.8%
1.0m = 6.92 ÷ 7.06 x 100 = 98%
From these results, we can see that the final results were very close indeed to my predicted results, therefore proving that they are reliable.
In order for the investigation to be fairer, I think the temperature of the wire should have been kept constant. This had an effect on the investigation, because from my research, I found out that another factor affecting the resistance in a wire was the temperature too. As the temperature of the wire increased, so did the resistance. This is because as the wire gets heated, the particles gain kinetic energy, therefore making the flow electrons harder. This makes the particles move around more, therefore colliding with the electrons, and blocking their way, and taking longer for the electrons to move to the other side of the wire. This results in an increase of resistance.
It would be very difficult for the temperature of the wire to be kept constant. A water-bath would not be suitable because there would be a potential health hazard, as water is an excellent conductor of electricity.
There is however a device known as a thermocouple, which can help us check the temperature is at a constant level or not. How it works is that it is connected in the circuit. They work in the sense that if the temperature of the wire goes above a given temperature, the thermocouple stop working, therefore breaking the circuit and so will not work.