I have formulated this hypothesis due to my knowledge of the flow of electric current through a circuit. As seen in my background information
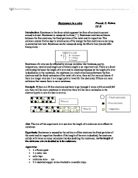
I predict that if I plot a graph of Resistance against wire thickness for my results I will get a graph similar to the one bellow
A table to show which variables we will need to control in order
For this to be a fair test and which ones we will measure:
Experiment one: wire thickness
Experiment two: wire length
Preliminary experiment
Doing a preliminary experiment is necessary when doing any investigation because it allows us to plan which variables and ranges will be suitable for use, for our actual experiment to give us reliable results.
Method for preliminary
Preliminary results
Experiment one
The gradient of this graph represents mass, so this shallow gradient shows that the mass must be large.
Evaluation of preliminary experiment
Our preliminary experiment shows us that we will be able to use this range of values for our final experiment since they gave us results that were relatively consistent with our hypothesis.
Equipment needed:
- Different lengths of Nickel Chrome (nichrome) wire(experiment two)
- Different widths of !0 cm long Nichrome wire (experiment one)
- Ammeter
- Variable resistor
- Voltmeter
- Power pack
- wires
- Crocodile clips
- Pulley
Method for final experiment
A table of results from the experiment:
Processing results
Preliminary results
Actual results
Analysis
Conclusion: Our findings do appear to have followed what we said in our hypothesis and seem to show the relationship that we predicted, but more experimentation is needed to prove conclusively.
We can definitely see, from our graph that the relationship between wire length and Resistance is, as we said a positive, proportional one, as the wire length increases, the resistance increases. This relationship shows a relatively proportional graph because when you increase the length of the wire there are more atoms in the wire, this means than in order for electrons to flow they must pass between these atoms, the fewer atoms the electrons jump between the less opposition there is to them in the circuit. What's more, they bump into each other less, and so don’t create friction and loose their energy as heat. If the electrons are loosing less of their energy then the resistance for a particular voltage must change ( V=I. R) and must get smaller because there is a bigger current to go into the equation.
The conclusion reasonably supports the prediction because all of the results that we collected follow the pattern we expected.
Analysis
Evaluation
ResistanceResistance is measured in Ohms (symbol Ω).
Resistance
The bigger the resistance, the smaller the current.
The very important equation
= x R
is an expression of Ohm's Law.
You this equation for the exam!
If the resistance of a is constant (stays the same)
for different values of V and I,
then a plot (graph) of V against I will be a straight line.
The gradient (slope) of the line shows how big the resistance is.
A is used to find a range of voltages and currents for a component.Components which obey Ohm's Law are and .
A component will only obey Ohm's Law at constant temperature
(meaning that the temperature must not change).In reality, an increase in current through a component
will change its temperature (the temperature usually goes up),
and so Ohm's Law is only an approximation
but it works quite well for many components.
The next page shows plots for components which don't obey Ohm's Law.