A water bath was used to control the temperature of the mixture. Hot water from a kettle was used to heat up the Trypsin and milk mix, and ice was added to the water bath to cool it down when necessary.
Trypsin was added to the milk and see how long it took for the milk to become transparent. A piece of paper was placed behind the test tube with writing on it. When the writing was clearly readable, the elapsed time on the stopwatch was recorded.
The temperature of the water bath was controlled by adding ice or hot water to it. Separate test tubes were used for the Trypsin and milk in the water bath, these were left for 1 minute so that the contents would reach the same temperature as the bath.
Preliminary testing took place to establish that the experiment would perform as expected, with modifications to the method if required.
This is the results of the preliminary test.
During the preliminary testing it was noticed that the temperature of the separate test tubes of liquids did not always reach the required temperature within 1 minute. It was decided to increase the time allowance to 2 minutes for the separate test tubes of Trypsin and milk get to the correct temperature before the were mixed together.
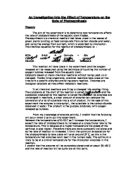
The equipment used for the experiment
Powered milk was used so that the amount of calcium in the milk would be controlled and be the same for each experiment. Normal milk has variable calcium levels and would not produce a fair test.
Diagram of the experiment.
The left test tube always had Trypsin in it and the right always had the milk in it.
After a 2 minute period the Trypsin and milk were at the correct temperature then we added them together as shown in the diagram below.
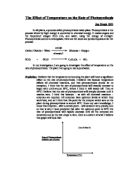
Data
Data was collected from the experiment 3 times at each of the 7 different temperatures. The collected data is displayed in the table below.
Analysis
The collected data is presented as a graph, showing the average time the mixture took to change to transparent against temperature over the 60 oC range. Each temperature was repeated three times so that an average time could be established, this would also show up gross errors in the experiment.
A line of best fit was used on the graph.
Conclusion
The graph clearly shows that for this experiment Trypsin’s activity rate is quickest just below the 40oC temperature. We know this because the mixture of milk and Trypsin went transparent quickest at 40oC.