My results:
Motor coil voltage (as shown)=4V, Field Voltage=9.80
Testing the accuracy of the joule meter
Before I analyse the results from my experiment I will test the accuracy of joule meter.
See Diagram 3: For Diagram of Apparatus used
Experimental Method:
I will supply the joule meter with a constant voltage and I will time how long it takes to record energy of 10J. From this information I will be able to compare the energy I put in to the joule meter and the energy it recorded and I will be able to draw a calibration curve.
My Results:
Load=10.3Ω
- I would have repeated my results for this experiment if I had more time
Analysing the results of the calibration experiment:
This is how I calculated the above values:
Power in= V2/R R=10.3Ω
Power recorded=10J/Time taken
Joules in=(Power in) *(time taken for 10J)
% Error=100(Joules recorded-Joules in)/Joules in
Is the power recorded equal to?
If the joule meter is accurate the power it records will be equal to . To test this I have plotted the power recorded against the voltage I recorded squared. This should give me a straight line in the form
In which y=Power recorded, m=1/R, x=V2, c=O since when V=0 P=0
I have also plotted a how the power should vary with respect to the voltage squared for use as a comparison. (see next page)
Analysis of the graphs:
The power recorded is roughly equal to the predicted power. The accuracy of the joule meter seems to vary with voltage (see graph 2); the joule meter is most accurate at very low voltages (0-0.5V) and it is least accurate at about 1-1.6V. This is unfortunate since these are the voltages that I have used in my experiments. The accuracy then appears to increase for voltages higher then 1.6V.
Since the accuracy of the joule meter varies predictably I have drawn a calibration curve for the joule meter (shown below). This graph will allow me to correct for errors caused by the inaccuracy of the joule meter when I analyse my results.
I have not had enough time to calibrate the joule meter using a wide range of voltages and energies and therefore my calibration curve is not as useful as it could have been.
Analysing my Results for Experiment 1 and 2
Experiment 1:
%E=stands for percentage error and it applies to the previous column
Explaining the graph:
In my experiment energy must be conserved, and it follows that the electrical energy I put in to the motor must equal the sum of the energy I get out.
If I first consider the system without friction: the equation below must be satisfied:
Electrical Energy In=(Energy lost in the internal resistance of the motor coils) +(Work done lifting the weight)
IVt=I2Rt+(Work done lifting the weight) t=time, R=resistance of motor coils
The power used lifting the weight is equal to εI, ε is the back ε.m.f resulting from the fact that the motor coils are moving through flux in a magnetic field.
IVt=I2Rt+εIt [1]
If I now consider friction which I am assuming is constant:
IVt=I2Rt+εIt+(Work done against friction)
IVt=I2Rt+ε It+ FD
Here F= frictional force D=distance mass has travelled
Before I can do any further analysis I must first calculate the internal resistance of the motor coils. In my analysis I am going to assume that the resistance is constant as this is a good enough approximation for calculations. In fact the resistance of the coils varies slightly with the speed and temperature of the motor.
Estimating the resistance of the motor coils
You can only measure the internal resistance of an electric motor when it in motion as a result of the effect of the commutator and other factors.
From my research I found out that for a motor
ω=Angular velocity of motor shaft, K=motor constant, T=torque provided by motor, R=resistance of motor coils, V=voltage.
If I plot ω against T the value of ω at y intercept is equal to and the torque at the x intercept is equal to . Using my recorded values and the intercept values I will be able to calculate the internal resistance of the motor.
1) Finding an expression for ω:
-
Average Circumference of cotton reel used to wind up string= 2π*(average radius of cotton reel)
Average radius≈0.02m
⇒Average Circumference=0.04π
- Total Number of rotations of the motor shaft=Length of string wound up/Average Circumference
=6.15/0.04π
- Number of rotations per second=Total No. of rotations/Time taken to lift weight
=
- ω=No. of rotations of motor shaft per second*2π
ω=307.5/t
2) Finding an expression for the torque of the motor: (ignoring friction)
Torque = Moment acting on the shaft
T=Force*Average Radius of Cotton reel
Average Radius=0.02, Force=1/6 of the weight because of the pulley system
⇒T=*0.02
⇒T=
Calculating values for T and ω from my results:
Estimation of y intercept=35
X intercept=0.0465
Calculating the internal resistance of the motor coils:
(Derived from the equations quoted above) V≈1.3V, T=0.0465, ω=35
⇒R ≈1.0Ω
I made many assumptions when I was calculating R. For example, I assumed that V and R are constant. I also assumed that ω was constant through out my experiment, when it actually decreased as the radius of the motor shaft increased. As a consequence of this the value of the internal resistance is only an estimation.
Can my model predict the amount of energy the motor needs to lift a weight a height of 1.025m?
Predicted Power in using my model= I2Rt+ε It+ FD
Estimation of frictional force≈7N(the force required to just move my pulley system)
R≈1ohm
Using my results to test my model
As you can see my predicted value for the amount of energy used by the motor is about twice the actual amount of energy used. The number of joules lost in the internal resistance is large fraction of the total energy used by the motor. This value has also got a high estimated percentage error and for these reasons I predict that it is the inaccuracy of this value that is causing the difference.
Of the two terms I have used to calculate the energy lost in the internal resistance of the motor, the current and the internal resistance of the motor, the internal resistance is the most uncertain.
By finding values of the internal resistance and the work done against friction that make the power in = the power predicted I will be able to get better estimations of these values and I will still be able to test my model.
I will try using the internal resistance as 0.51ohms
My results:
Graph using revised results:
As you can see a value of R=0.51ohms is an accurate estimation of the internal resistance of the motor since it makes the predicted power in very similar to the actual power in. This curve also shows that my model is very accurate since it predicts the energy needed to lift a wide variety of weights. The small curves in the line can be explained by experimental error.
There is still one problem with this curve; this is that it doesn’t quite pass through the origin. The graph should theoretically pass through the origin since a motor lifting no weight shouldn’t use any power.
Using my model to explain the Efficiency/Weight lifted graph:
My model:
(Energy used by motor)=(Energy lost in the motors internal resistance)+(Work done lifting weight +Work done against friction)
Or IVt=I2Rt+ε It+ FD
For small masses:
When the motor is lifting small masses it does not require much current, since torque of a motor is proportional to the current in the motor coils. This is true since the force exerted on the motor coils is equal to BIL (where B=field strength, L=length of coil perpendicular to the magnetic field, and I=the current). If you look at my results you can see that the current is small for small loads.
When the current is small the work done against friction is the term in which most energy is wasted. This value is very large in comparison to the work done lifting the weight and the energy lost in the motor coils for small currents. As a result of this the motor is not very efficient.
Efficiency for small weights==
If you assume that the work done against friction is constant, I∝M, and V is constant
⇒
This explains the y=1-1/x form of the first half of the graph..
For large masses:
When lifting heavier weights the motor draws I higher current in order to provide the extra torque required to lift the extra weight. Consequently the I2Rt component becomes large and the work done against friction becomes insignificant.
It follows that the equation can be approximated to:
IVt=I2Rt+ε It
Efficiency=
=
If we assume that V and R are constant and the and that I∝M, you get a straight line in the form y=mx + c
E∝1-kM, where k∝R/V
This explains why the later part of my graph appears to be linear.
The percentage efficiency that I got for 1200g weights does not quite fit the pattern of my other results.This was probably caused by experimental error.
Analysis of my results for Experiment 2
In experiment 2 I have tested the efficiency of the motor when lifting masses ranging from 900-1700 grams. Using my results from my last experiment I predict that the efficiency of the motor will decreases linearly with increasing mass.
The efficiency of the motor in experiment 2 does decrease linearly with increasing mass as I predicted.
Ideally the two graphs should follow each other since I used the same motor in each experiment. However from my graph you can see that my calculated efficiency for the second experiment is consistently about 9% higher than the calculated efficiency from my first experiment. This difference has probably been caused by the inaccuracy of the joule meter. This is inconsistent with my results from my calibration experiment. They showed that the joule meter always records more energy that it is receives and therefore if I correct my results for experiment 2 it would make the motor even more efficient.
However the linear sections of the graphs have the same gradient and this shows that in both experiments the efficiency is varying in the same way.
Extension:
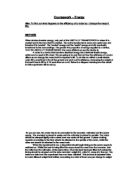
Aim: To measuring the efficiency of the electric motor as a generator and to establish if the system is time reversible.
The experiment:
See Diagram for circuit digarm.
Experimental method:
I will dropped a variety of weights a distance of 1.12m and then I recorded the amount of electrical energy produced by the motor using the joule meter
Acknowledged Errors
- The inaccuracy of the joule meter-however I can use my calibration curve to correct for this
- Friction in the pulley system
- The weight has kinetic energy when I hits the ground and this energy is lost from the system thus reducing the efficiency of the generator.
My Results:
H=1.12m load=10.3 ohms
Graph:
Explaining the graph:
The energy I put in the generator is dissipated in three ways.
- Useful energy is dissipated in the load
- Energy is lost in the friction of the pulley system
- When current flows through the internal resistance of the motor energy is lost
- Energy is lost when the weight I drop hits the flaw
It follows that because energy is conserved:
The Potential energy of the weight=
Power dissipated in load
+ Work done against friction
+Energy Lost in the motor’s resistance
+Energy lost as the weight hits the floor
M=mass, I=current, F=friction force, R=resistance, V=final speed of weight
In my analysis I have chosen to ignore the energy lost in the internal resistance of the motor. This is sensible since the energy lost in the internal resistance was insignificant compared to the energy lost in the load. To further simplify things I will also ignore the energy lost as the weight hits the ground. This factor was very small because my weights travelled quite slowly and they had small masses.
Simplified formula for analysis:
Efficiency∝∝
If you assume that the work done against friction is constant this formula explains the 1-1/x form of my graph. For small weights the generator is inefficient since most of the weights potential energy is being used to overcome friction. For small the second term of the formula is large and the generator is therefore inefficient. This is shown by my graph.
For large weights the work done against friction becomes insignificant and consequently the generator becomes more increasingly more efficient. For larger the second term would tend to zero and the efficiency should tend to 100%. My results do show that the efficiency increases for heavier weights however my results appear to approach an efficiency of 14% not 100%. This difference may be caused by the fact that for my larger weight the energy lost in the motor’s resistance and the energy lost as the weight hit the floor become significant. The inaccuracy of the joule meter may have also contributed to this difference.
Is a the motor time reversible
If my motor was time reversible it should behave in the same way irrespective of the direction of time. For example if you use electrical energy lift a weight with a motor if the system is time reversible you should be able to get the electrical energy back by dropping the weight.
A motor is obviously time reversible to an extent since it can be used both as a motor and a generator. However my results show that for my experiment you are only able to retrieve a small fraction of the energy you used lifting when using the motor as a generator (about 2.5 joules out of 150 or 2%).
This inefficiency can be partially explained by considering the parts of the system that are not time reversible. This includes the friction in the system and the energy lost in the internal resistance of the motor. Here energy is lost as heat and sound that cannot be retrieved.
Conclusion:
In general my experiments went well and I was able to use my result to make some useful conclusions. I was very pleased with the accuracy of my results.
If I had more time I would have taken more experimental reading so that I could get a more complete picture of what was happening. I would also have spent more time calibrating the joule meter since it’s inaccuracy had a large effect on my results.
Bibliography:
Sources used:
- Nuffield Advanced Science Physics student guide 2 unit H to L, Published by Longman, ISBN=0-582-35416-1
- Web page: “Motors” URL=www.srl.gatech.edu/education/ME3110/design-reports/RSVP/DR4/Motors.http
- Encyclopaedia Britannica CD-ROM
- Encarta 99 CD-ROM by Microsoft