This would be easy to do. I would keep the material and width of the wire the same. As the L α R, it can link the length of a wire to the resistance of it, making my graph more appealing and this is why I have chosen to investigate the length.
I will set up a circuit as shown:
The ammeter must be connected in series so all the current has to flow through the ammeter. If it were in parallel, some of the current would travel along the other wire. The voltmeter is connected in parallel, as the voltage is the same across the circuit when in parallel. The voltage will be kept low, to minimise resistance and to prevent any dramatic increase in the temperature of the wire. I will use a digital voltmeter rather than an analogue one, as this will be able to give me a more accurate reading, as when reading the needle, it’s quite hard to read it accurately. The more voltage the hotter the wire becomes, therefore making the electrons move faster, losing more energy through collisions.
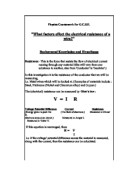
I will measure the current through the ammeter and the voltage through the voltmeter in the circuit, and use the readings for this to calculate the resistance of each different length of wire, through Ohms Law:
R=V/I
R=resistance V=Potential difference I=Current
I will use a 0.26mm thick piece of wire, as I didn’t want a wire that was too thick as its resistance would be too high and a wire that is to thin its resistance would be too low. I will take 5 results all together, 2cm, 4cm, 6cm, 8cm and 10cm long, because this is a reasonably amount of results to take. Having 5 results will also produce a better graph. I will do 2 repeats of each measurement to make my findings more reliable and to find any anomalous results.
To make my experiment a fair one and that the results will be more reliable and accurate, I will only have one variable that is the length and keep everything else the same. I will try to keep the room temperature constant by making sure windows and doors are shut to stop any changes in temperature. I will keep the time that I allow electricity to flow through he circuit the same, 10 seconds. Also if I left the circuit connected too long, the wire will get too hot and burn. I will disconnect the wire if the current reading gets too high. An average will be taken to make my results more reliable. I will make sure that the crocodile clips will be clipped at the very ends of the wire to make sure that current flows through all of the wire.
Prediction
I predict that the longer the wire, the resistance will increase. This is because, if you double the length then the number of atoms that the electrons will collide with will also double, causing more collisions and slowing the electrons down and increasing the resistance. In the diagram, it shows, that the outer electrons can move freely in a metal compared to another material, plastic for example.
Therefore the relationship between the length of the wire and the resistance should be directly proportional. The graph will be a straight line through the origin, because current is proportional to voltage. R= V α I. My graph will therefore look like this:
For each different wire of the same material, the resistance(R) of each wire is
1)Proportional to its length
2)Proportional to 1/A (where A is the area of the cross-section of the wire)
We can then, therefore create an equation for the resistance of each wire in terms of a constant of proportionality called Resistivity.
R=PL/A
Where R=resistance
P=Resistivity of the metal
L=length
A=area of cross-section
With this equation, we can work out why copper is used for wires, as its Resistivity is very low. The electrons will move towards the positive charge, when an electrical potential is applied, as like charges attract. Electricity will flow from the negative terminal to the positive terminal. The electrons are the charge carriers that carry electricity through the circuit.
Method
Equipment: Power Pack
Voltmeter
Ammeter
Wires with crocodile clips/croc and plug clips
Reel of wire
Scissors
Micrometer
Calculator
Ruler
Stopwatch
Circuit
I will take the wire and cut a 10cm strip with the scissors. I will be extremely careful when trying to cut the wire, as it’s sometimes a struggle. I will set up a circuit like the one above. I will connect the wire to the circuit to act as the resistor. I will make sure that the ammeter is connected in series and the voltmeter is connected in parallel. I will set the power pack to direct current D.C. and turn the power pack to 2V to give it only a low voltage as I’m only using a small length of wire, BUT I WILL NOT SWITCH ON THE POWER PACK YET to avoid any accidents! Once the circuit is fully connected, I will turn the power pack on. I will then start the stopwatch and time for 10 seconds and then record the readings on the ammeter and voltmeter. I will then turn the power pack off. I will then take out the wire and cut it to 8cm and repeat the above, but with an 8cm piece of wire. I will then do the same for all the other measurements. I will then do this two times for repeats and a more reliable result.
Results Table
I have repeated the ‘10cm’ length of wire again, as when I looked at my results, I could see there was an error. I drew the graph to check if there was an error, here is the graph:
The graph as you can see, the line goes up to 0.87Ω and then drops to 0.83Ω, which isn’t right, as the longer the wire is the higher the resistance will be. So I decided to repeat the 10cm piece of wire again to double check if I have made some fault in my experiment. I did and I got a more reliable result, with 0.97Ω.
Analysis
The results from my experiment show me that prediction was correct. I said that as the wire length increases so does the resistance and my results prove this. My graph shows a strong positive correlation. This show that as length of the wire increases the resistance increases also. I also said that they would be directly proportional to each other, e.g. wire of length 2cm, the resistance is 0.17Ω and at 4cm, the resistance is 0.38Ω. This nearly doubles the size, which shows that my prediction was correct. Why this happens is explained in my prediction. Resistance is caused by free electrons travelling through a wire, but is slowed down by collisions with atoms. Doubling the length will double the amount of collisions, therefore doubling the resistance. My line of best-fit show, that my results did follow the expected pattern of my prediction well. All the points are quite close to the line. The line does not go through the origin because even when the wire is at 0 length, there will still be some resistance in the circuit wires.
Conclusion
From carrying out my experiment, I can conclude that the longer the wire is the higher its resistance will be. This is explained in my prediction. If you increase the length of the wire, you are also increasing the number of atoms, therefore increasing the amount of collisions between the electrons and the atoms. This in turn slows down the electrons and increasing the resistance. If the length of wire doubles, resistance doubles providing the thickness of the wire is constant. In the diagrams that I have drawn below it will explain how this happens.
Evaluation
I think I could’ve planned my experiment better if I was given more time, I would’ve have been able to research into it more to be able to plan my experiment more better. My method was easy to follow and it was suitable in conducting this particular investigation. I’m quite happy with my results, which I have accumulated from my experiment. My results and graph both support the conclusion I have made. As the length of the wire increases so does the resistance. As there will be more wire for the free electrons to flow through, causing more collisions.
By looking at my results table, I could see that my ‘10cm’ length of wire was not reliable. The average resistance of a ‘10cm’ wire, with a diameter of 0.26mm was 0.83Ω. This was less than the ‘8cm’ piece of wires’ average resistance. I didn’t agree with this, as I know that as the length of the wire increase, so does the resistance. This was an anomalous result. So I decided to repeat it again, for the ‘10cm’ piece of wire. When I had repeated this again, the result was more promising. The average resistance was higher than the ‘8cm’, this is what should be happening. This anomalous result probably occurred due to inaccuracy measurement of the wire, the way the wire is connected to the circuit or the temperature of the wire, which may have increased sue to being too close to the circuit.
I think I could’ve made my experiment more reliable, in terms of measurement. I feel, perhaps, I could’ve measured the wire more accurately. It was hard to measure the wire, as it was previously wrapped around a reel, therefore it had waves in it. Next time, I think, I will cello tape the wire on the work surface and then measure it, to keep the wire as straight as possible. This inaccurate measurement could mean that my results were inaccurate, giving me unreliable results.
There is also my rounding in my figures to a suitable degree of accuracy, which in this case, is to two decimal places. I feel this to be of appropriate degree of accuracy, as the voltmeter only reads to an accuracy of two decimal places. I also had to read an ammeter with a dial, so when reading the reading, it was of my own judgement, and this was not reliable. I therefore to improve the experiment, I will use a digital ammeter in my circuit. When working out my averages, I think I could use the not rounded off figures to calculate the resistance, to make my results more accurate.
To improve my experiment next time, I think I would use wire length no smaller than 10cm, as then I could perhaps increase the voltage, to see if that makes any difference. A length smaller than 10cm with a higher voltage than 2V would overheat making the temperature of the wire increase and increasing the resistance. I would perhaps next time, make the width as my variable and the length as my constant and see how the width will affect the resistance of a wire.