Prediction:
The acceleration of free fall is same for objects (masses and light) at the same rate until there is no air resistance. So when there is air resistance the heavy object will take less time to reach the ground than the less heavy object.
Apparatus:
I will need the following equipments for the experiment:
- Clamp stand
- 2 meter rulers
- Cello tape
- Spirit level
- 1 extra clamp
- Stop clock
Diagram:
Method:
First I will put clamp stand and then I will join the 2 rulers together with cello tape and then I will put the rulers straight and clamp them. To make sure the rulers are straight, I will use the spirit level. Then I will measure the time by dropping case from the top. I will repeat the experiment, but this time I will use 2 cake cases instead and then 3 and so on. When the dropping the cake cases, I will note the time taken by the objects to reach the ground.
Fair test:
To ensure my results are accurate and fair I will:
- Drop all of the cup cakes from the same height of 2 meters at the same angle.
- Dropping each one 3 times and then finding the average.
- Use the same size and type of cake case each time.
- Make sure the same conditions are kept constant throughout.
Variables:
If I needed to complete the experiment again and compare my results with another then I could change one variable. These however must be changed one at a time or the tests wouldn’t be fair and the results would be inaccurate because the results would be vague due to the uncertainty of how they differ from before due to having more than one variable.
The range of variables for this experiment is:
Number of cup cake holders- I chose this one because it is probably the most simple and easy to set up yet has the best outcomes and most accurate results as patterns and graphs can be made with ease.
Conditions- This change would mean testing just one cup cake holder in various conditions and making valid observations and reasoning to why and which conditions affect the rate of terminal velocity.
The way it which it is dropped- If this variable was used then the cup cake holder could be dropped sideways therefore decreasing the surface area meaning the air resistance will be less and as a consequence the terminal velocity changing.
Preliminary work:
I used one ruler to take the preliminary reading before setting up my main experiment. This was completed before the main experiment by taking 6 cup cake holders (the maximum amount of cups I will use in the experiment), and timing how long they took to reach the ground from different heights. (In these preliminary results I changed the height to 1m so I could find out clearly about my prediction). The table of results that I got for my preliminary work:
It is clear from the results of the preliminary work that the more cake cases had taken less time to get to the ground then the less cake cases. I am now going to do my main experiment.
Main experiment:
Following are my results which I get by doing my main experiment:
Relationship between cake cases and time (in seconds)
The results above show all 3 attempts in order to gain an accurate average to be able to plot a graph to simplify the results collectively.
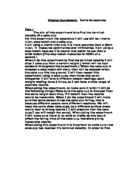
Graph Analysis:
The results gained from the experiment show that my prediction was correct, as the amount of paper cups decrease the time taken. The more the cake cases the shorter time it has taken for it to hit the ground. And less the cake cases, more the time it has taken to reach the ground. At the instant of release there is no friction because the object is not moving. The weight of the object makes it accelerate downwards, because gravity is acting on it, the heavier the object the faster it will accelerate. The results show that the time the object has taken decreases steadily each time. This shows that adding extra weight decreases the time to reach to the ground. Although there is one point on the graph which tells different story, I will discuss this in my evaluation.
Conclusion:
I can conclude that the time does depend on the weight, and this can be clearly seen when looking at my graph which follows a steady decline in the time take for the cups to drop. If I had decided to use the way it was dropped as variable then my results would have differed slightly, this is because the surface area would change if for example they were dropped at an angle then the times maybe would have had a slower decrease. The graph would have looked more or less the same but the time taken for the cups to fall would be longer.
Evaluation:
I think the experiment worked quite well, a lot of reliable results were obtained which could be analyzed easily and this meant we were able to complete the aim. Most of the results are quite reliable; we did 3 experiments at each weight (3 drops with a total of 6 cup cakes) and took an average, which meant they were quite reliable. But because of human error they may not have been as reliable as they could have been; these human errors are responsible for the anomalous results on the graph. We could have improved the experiment by using electronic sensors, to drop the paper cases; this would have eliminated human error. The main error I think was delayed reaction times. When the cup/s was dropped, it would have taken the timer some time to start the stopwatch after it had passed the beginning of the timing point. Also if different people were timing they would obviously have different reaction times therefore affecting the results. If I did this experiment again I would have the same person each time, also I have the person timing standing at a point where they could clearly see when the cake cup passed. Also the stopwatch could only be measured to an accuracy of a 10th of a second. Another problem that occurred was that when the cake cup fall though the air there was some movement. The cup tended to sway from side to side which meant there would not be a constant area,(meaning the surface are constantly changing) which would obviously effect our results as there would be extra movement from side to side. If I were to do the experiment again, it would be hard to eliminate this error. The only way this could be slightly improved would be to ensure the best conditions possible to do the experiment in (a wind and draft free place.) After I had plotted my graph I found that there was one anomalous result, and this could have been because of any of the errors above.