-
Controlled: -The period and amount of minutes that were regular between each trial (1 minute).
Method:
I) First I measured my BP and PR at a completely rest, my Pulse Rate and Blood Pressure at rest were: 70 & 130 over 90, which is the standard measurements ad the normal ones for a 16 years old as I am.
II) Then I made a cup of tea by letting the tea bag for a while to be concentrated and to touch the differences while measuring the data after the experiment, then i drank it slowly
III) After ten minutes I measured my blood pressure and my pulse rate.
IV) And then I kept re-measuring my blood pressure and pulse rate every 1 minute, I kept doing it for 5 consequently times.
This is what I got from my measurements
From the first look at the data I got after measurements we can say that the both the pulse rate and the blood pressure doesn't have a particular scale or a certain sequences, as they varies from high to low in each measurements, if w compare the 2nd with the 4th for example !
Processing Data
Now let's put this data on another way of presentation, by their percentages evaluating both the pulse rate and the blood pressure with its two types (Systolic and Diastolic), to illustrate better the patterns of the experiment...
Pulse Rate:
Blood Pressure:
Systolic:
Diastolic:
Then now let's put all this data in three different diagrams to see how does they affect on the blood pressure and the pulse rate as well:
So I can deduce that ] the tea decreases my pulse rate and decreases my blood pressure, as mentioned in the graphs and as shown in their percentage of change between the initial and the second measurements, which means that tea is a good drink for people who get nervous quickly. After drinking tea to see its effects on the blood pressure and heart rate. At Actually I predicted that there will be an increase in my blood pressure and my pulse rate, but my experiment my expectations was wrong, or the opposite I mean. Tea has decreased my PB and as well as my PR
Limitations/Methods Of Improvement:
There were various limitations during my experiment; uncertainties were a a little bit high (±5 mmHg and ±1 BPM) except for the Stopwatch which had an uncertainty of ±0.01 sec and the percentage of difference as it was ± 0.1% , also their was a limitation that during taking the measurements after finishing use the actual experiment I was walking and going down stairs, which may has also affected my degree of accuracy of measurements and also has led to limitations that has negative effects on my raw data.
so to improve this in the next experiment, more sophisticated materials and devices as using electric or automatic devices, because they may come with some unreal results.
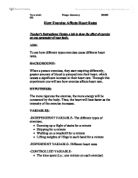
2ND EXPERIMENT (EXERCISE):
Materials:
a)Stopwatch – ±0.01 sec
b)Number of people required – 2
c)A floor of steps (stairs with 25 steps)
d)Stethoscope.
e)Sphygmomanometer ±5 mmHg
Variables:
-
Independent: Amount of exercise done
-
Dependant : Heart beats
-
Controlled: type of exercise, weather, time
The exercise that will be performed will be same for every trial; only, the amount of exercise done will be fair. I while performing the experiment
I except starting doing this second experiment that when the amount of exercise performed increases, the number of heart beats per minute will also increase steadily till a certain point.
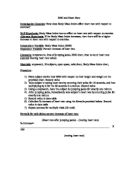
Method:
- Measurement of my heart beat before the experiment
- Start the experiment by doing the exercises, going up and down with stairs in on flight (25 steps)
- Measure the number of heartbeats every 1 minute by using a stopwatch
- Repeat the exercise 3 times with doubling the distance that i took
- After that, I should perform completely relax and do not eat or drink or even walk after the exercise to have an accurate and successful data
these are the results of my experiment...
measurements of heartbeats
Processing Data
Percentage change on heartbeats, starting with the first trial then the second one....
To conclude, from both graphs, we can deduce finally that "the rate at which the heart beats is affected by the amount of exercise performed". This is because when we exercise, the rate of oxygen in the blood and the body is used quicker than usual or at rest, as we see if we compare the rate of decrease on both graphs, trial one and the other, the second one has a lower rate of decrease than the one above, which agrees and support the statement above and the one coming down. "But later, the heart becomes stronger due to its continual pumping of blood throughout the body". The number of heart beats per minute also depends on my fitness, which is a limitation.. From this experiment and the results, we can say that my expectations was proven correct.
Limitations
'The number of heart beats per minute depends on certain conditions of the body such as exercise and any pressure physical or mental that is applied on a person affects the rate at which the heart beats', which was my situation because I was having a exam period during the experiment process
I could have some errors concerning counting the number of heart beats and also could have been an error in the counting of 1 minute on the stopwatch, both of these limitations are under the title high uncertainties rate which I may improve next time by minimizing these rates of errors
Finally concerning the two experiments, the one for the drinking of tea and the other of the exercise, I can say that if discovered lots of valuable tricks and info during both the experiment process and the lab report as well...