Time
All four chromatographs were placed within the test tubes at relatively similar times to ensure that there is an insignificant time difference between the four samples. Thus, this could reduce the percentage error within the experiment.
Methods
Materials & Apparatus
- 4 Test tubes
- Filter papers
- Glass rod
- Two disposable gloves
- Graduated cylinder (50 ml) ±0.5
- Different colored plant leaves: yellow leaves, green leaves, purple leaves and variegated leaves
- Acetone
- 30 cm ruler
- Funnel
- 4 Paper chromatographs of same size
- Pen
- Safety goggles
- Labels
- Test tube rack (x 6)
- 4 beakers (100 ml ± 0.5 ml)
Procedure
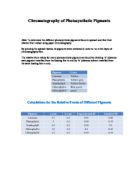
The data collected throughout the experiment will be displayed in a data table. The experiment can be repeated twice, so the data table will represent results for both trials and the average. The data tables include the colored leaves for each sample for the experiment the colour within the chromatograph and the amount traveled within the chromatograph (cm) with an uncertainty of ± 0.05 cm.
Qualitative Data
Chromatography paper is cut in half to fit in test tubes. Each chromatography paper is dipped into the test tube with the solution (1.25 cm deep). For the first hour of the experiment, fade green color was present in test tubes 2, 3, and 4. Test tube 1 showed no color within the paper chromatograph. However, after the first 30 minutes, a slight break within the chromatograph of Test tube 2 is present. After 1.0, Sample 1 has shown a slightly darker shade of yellow than recorded previously. For sample 2, there is an increase in the shade of green within the breaking point on the chromatograph. For sample 3, there is no significant change; however, there is a slight change in the colour of the paper chromatograph. For sample 4, a light shade of pink is present at the top of the paper chromatograph. After 1.5 hours. Yellow leaves show a greater range of yellow shade within the chromatograph, there is no change in the amount traveled. For sample 2, there are 4 shades of green and 2 shades of yellow within the chromatograph. There is no increase in the amount traveled within the chromatograph. For sample 3, there is no change in the number of shades within the chromatograph and the amount traveled. For sample 4, there are 2 shades of green, one of the shades has darkened within the chromatograph, and there is a darker shade of pink colour present throughout the chromatograph.
Thus, the chromatography paper is cut in half to fit in test tubes. Each chromatography paper is dipped into the test tube with the solution (1.25 cm deep). For the first hour of the experiment, fade green color was present in test tubes 2, 3, and 4. Test tube 1 showed no color within the paper chromatograph. However, after the first 30 minutes, a slight break within the chromatograph of Test tube 2 is present. After 1.0, Sample 1 has shown a slightly darker shade of yellow than recorded previously. For sample 2, there is an increase in the shade of green within the breaking point on the chromatograph. For sample 3, there is no significant change; however, there is a slight change in the colour of the paper chromatograph. For sample 4, a light shade of pink is present at the top of the paper chromatograph. After 1.5 hours. Yellow leaves show a greater range of yellow shade within the chromatograph, there is no change in the amount traveled. For sample 2, there are 4 shades of green and 2 shades of yellow within the chromatograph. There is no increase in the amount traveled within the chromatograph. For sample 3, there is no change in the number of shades within the chromatograph and the amount traveled. For sample 4, there are 2 shades of green, one of the shades has darkened within the chromatograph, and there is a darker shade of pink colour present throughout the chromatograph.
The experiment can be repeated twice, so the data table will represent results for both trials and the average. The data tables include the colored leaves for each sample for the experiment the colour within the chromatograph and the amount traveled within the chromatograph (cm) with an uncertainty of ± 0.05 cm. Thus, the experiment has been carried on for three times to achieve more accurate results and to represent a clearer bar graph and pie graph for the analysis throughout the analysis and the t-tests demonstrated further on in this paper.