Material
1 slide of the root tip of Allium
1 slide of the root tip of Vicia faba
4. Procedure
See the worksheet
5. Results
Table 1 showing the number of cells in each phase of mitosis in Allium
Table 2 showing the number of cells in each phase of mitosis in Vicia faba
Table 3 showing the percentage number of cells, average percentage number of cells and standard deviation of percentage of mitosis in Allium
Table 4 showing the percentage number of cells, average percentage number of cells and standard deviation of percentage of mitosis in Vicia faba
Showing calculations
Percentage number of cells for all the samples = [one phase/ Σ phases] x 100
Average percentage number of cells = (Σ percentage number of cells)/(number of samples)
6. Discussion and result
Anomalous results
There were 6 anomalous readings in the data collected. There are highlighted in tables 3 and 4. Their values differ greatly from those of other replicates. They also clearly do not conform to the trends shown by the values obtained in the other replicates. As a result, they have been excluded when calculating the average percentage change in mass and standard deviation.
Results of investigation
As shown by the values in table 3 and table 4, there was the largest percentage number of cells at prophase and the lowest percentage number of cells at anaphase. The range of prophase from 56.2% to 70.4% while the range of anaphase from 4.7% to 5.4%. Because many cells are observed to be at particular phase, that phase occurs over a long period of time and vice versa. As a result that prophase is the longest phase of mitosis and anaphase is the shortest phase of mitosis.
Prophase is the longest phase of the mitotic division. Chromatin takes longer to become tightly coiled and each condenses to form a visible chromosome than it does to do the splitting. Spindle begins to form. This also carries the stage where the cell is transiting from prophase to metaphase. At this stage, each chromosomes is attached to a spindle fibre via its centromere by means of a protein know as kinetochore. The nuclear membrane and nucleolus completely disappear. The centrosomes reach the opposite ends of the cell. In the next phase, metaphase, the spindle is completely formed. The chromosomes convene at the metaphase plate, with a spindle microtubule attached to one of the sister chromatids from one pole and another spindle microtubule attached to the opposite sister chromatids from the other pole. Anaphase is shortest phase because this phase occurs very rapidly. The pair of sister chromatids separate and the spindle microtubules pull them towards the pole of the cell. The centromere of each chromosomes divides into two. As they split, they pull the attached sister chromatids apart. During telephase, the last stage of mitosis, the nuclear membranes and nucleolus begin to reform. The chromosomes uncoil; the cell begins to pull apart into two separate cells at the cleavage aster.
Calculate the percentage number of cells of each phase in order to determine easily the population of the cells occupied in each phase in the whole four phases. And these data can express by bar chart. Because it has independent variables do not have numerical values and also provides a strong visual representation of the proportions in each phase. This helps to determine easily the largest location where the cells occupied and compare each other.
7. Conclusion
-The percentage number of cells in prophase is highest in four phases and the percentage number of cells in anaphase is lowest in four phases of two roots in mitosis. Hence, prophase takes the longest time and anaphase takes the shortest time in mitosis. This agrees with the hypothesis proposed for the investigation.
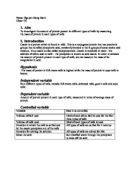
8. Evaluation
There are various weaknesses and limitations observed in the investigation. They are summarized in the following table together with suggestions for their improvements.
9. References
1. Core 2. Cells – 2.5 Cell Division
2. Biology Course Companion; Allot and Mindorff