
Parallelograms. This investigation will focus on the number of parallelograms formed by intersecting lines also knows as transversals.
Parallels and Parallelogram Internal Assessment By: Olivia Bloch This investigation will focus on the number of parallelograms formed by intersecting lines also knows as transversals. Figure 1 below shows a pair of horizontal parallel lines and a pair of parallel transversals. One parallelogram (A1) is formed. This figure with two transversals and two horizontal lines will be transformed by adding more transversals, and hence establishing the relationship between the number of transversals and parallelograms. The parallelogram is indicated in red. Set Notation: A1 Figure 2 below demonstrates how adding one transversal can form 3 parallelograms, and these are indicated in red, blue, and green. Set Notation: A1, A2 and A1 ? A2 Six parallelograms are then formed when adding a fourth parallel transversal, as seen in figure 3. The different parallelograms have been done using different colors, and the set notation illustrates the color it belongs to. Set Notation: A1, A2, A3, A1 ? A2, A2 ? A3 and A1 ? A2 ? A Set Notation: A1, A2, A3, A4, A1 ? A2, A2 ? A3, A3 ? A4 and A1 ? A2 ? A3 ? A4 Set Notation: A1, A2, A3, A4, A5, A1 ? A2, A2 ? A3, A3 ? A4, A4 ? A5, A1 ? A2 ? A3, A2 ? A3 ? A4, A3 ? A4 ? A5, A1 ? A2 ? A3 ? A4, A2 ? A3 ? A4 ? A5 and A1 ? A2 ? A3 ? A4 ? A5 Set Notation: A1, A2, A3, A4, A5, A6, A1 ? A2, A2 ? A3, A3 ? A4, A4 ? A5, A5 ? A6, A1 ? A2 ? A3, A2 ? A3 ? A4,

Math IA - Matrix Binomials
IBO INTERNAL ASSESSMENT Matrix Binomials Mathematics SL Type I Katie Xie Mrs. Cheng 9/23/2008 Let X=and Y=. Calculate X2, X3, X4; Y2, Y3, Y4. X2=X ? X X2= X2= X2= X3=X2 ? X (Matrix multiplication is associative) X3= X3= X3= X4=X3 ? X X4= X4= X4= Y2=Y ? Y Y2= Y2= Y2= Y3=Y2 ? Y (Matrix multiplication is associative) Y3= Y3= Y3= Y4=Y3 ? Y Y4= Y4= Y4= As we can see, a general trend emerges as we increase the power of the matrix. There is a definite relationship between the power of the matrix and the end product (entries in the matrix). We observe that when X is to the power of 2, i.e. X2, the matrix's entries are all 2's; when X3, the entries are all 4's; when X 4, the entries are all 8's. For the Y matrix, a similar pattern emerges, except in this case, we must note the negative signs. However, these two negative numbers always occupy the same position in the matrix when the power is increased. Through consideration of the integer powers of X and Y, we can now find expressions for Xn, Yn, (X+Y)n. We observe that the elements of the matrices appear to form a geometric sequence; thus we can use the general equation for a geometric sequence to determine the expressions for Xn, Yn, (X+Y)n: , where Un=a specific term a=first term r=common ratio (multiplier between the entries of the geometric sequence) n=the number of the specific term

This particular mathematics graph interpretation will discuss how graph of differs from and. The purpose of this project is to study the relationship among those functions.
Introduction This particular mathematics graph interpretation will discuss how graph of differs from and. The purpose of this project is to study the relationship among those functions. The guiding question is: How do they differ from one another and what patterns do they have? Hypothesis The function will differ from the other function by having all the parts of the function below the x-axis, where negative units lie for y - axis, as a horizontal reflection. Because absolute value can only have positive value as a result, the function will also have positive value only. Therefore, when having an absolutely value graph, because only positive value exists, the negative value part of the graph will reflect upon x -axis. In addition, the original graph's y - intercept and range will have positive sign of the original value and be equal to or greater than zero respectively for absolute value function. Comparing and Absolute value graph of and General Statement When changing the equation from to, the bottom part (the part where y has a negative value) of the graph reflects upon x-axis and in the graph, the change in y-intercept and range occurs and everything else such as x-intercept, domain, and asymptote remains the same. Changing the equation from to When we have a graph of y =, we take the absolute value of y. If it is positive, it leaves the number
Modelling the course of viral illness
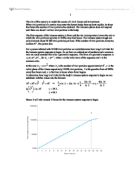
The aim of this essay is to model the course of a viral illness and its treatment. When viral particles of a certain virus enter the human body, they replicate rapidly. In about four hours the number of viral particles has doubled. The immune system does not respond until there are about 1 million viral particles in the body. The first response of the immune system is fever and the rise in temperature lowers the rate at which the viral particles replicate to 160% every four hours. The immune system tough can only eliminate about 50 000 viral particles per hour. If the number of viral particles, however, reaches, the person dies. For a person infected with 10 000 viral particles we could determine how long it will take for the immune system response to begin. As we have an ordered set of numbers and a common ratio we could consider this to be a geometric sequence. The form of a geometric sequence is So , where is the initial term of the sequence and is the common ratio. In this case where is the number of viral particles approximately, is the initial phase of the illness respectively 10 000 viral particles, is the growth of rate of 200% every four hours and, is the time in hours where fever begins. To determine how long it will take for the body's immune system response to begin we can substitute with the values into the formula: Hence it will take around hours for the
Investigation Transformations.
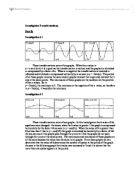
Investigation Transformations. Part B: Investigation # 1 These transformations were of sin graphs. When the a value in y = a sin k (x-b) + d is positive the transformation is vertical and the graphs are stretched or compressed by a factor of a. When a is negative the transformation is inverted or reflected and stretched or compressed vertically by a as seen in y = -3sin(x). The period of all these graphs remains the same and all graphs intersect the origin and intersect the x axis at the same points. The maximums of these graphs are the numbers are the positive of the a values. So in y = 2sin(x), the maximum is 2. The minimum is the negative of the a value, so therefore in y = 2sin(x), -2 would be the minimum. Investigation # 2 These transformations were of cos graphs. In this investigation the k value of the equations were changed. As shown when the k value is greater 1 the graph is compressed horizontally by the factor 1/k as seen in y = cos(2x). When the value of k is greater than 0 but less than 1 like in y = cos(1/2) the graph is stretched horizontally by a factor of 1/k. As you can see all the graphs pass through the y-axis at 1 but the graphs do not pass through the x-axis at the same points. The maximums and minimums of these graphs are all the same because the value was the same in all graphs. From these graphs we can determine that the value of
Mathematics portfolio on Infinite Surd
Mathematics Portfolio Standard Level Type I Infinite Surds Germaine An A surd is a sum with one or more irrational number expressed with a radical sign as addends. Examples are 1+V3, V2+V3, and V(1+V(1+V1)). Therefore, an infinite surd has an infinite number of such addends. An example is in the diagram. The following expression is an example of an infinite surd. Consider this surd as a sequence of terms an where: ==1.414213562 ==1.553773974 ==1.598053182 ==1.611847754 ==1.616121207 ==1.617442799 ==1.617851291 ==1.617977531 ==1.618016542 ==1.618028597 According to the result, you can aware that a2 = Then analyzing the formula, an+1 = On the graph, it represents that at the point of the beginning it raises rapidly as acceleration. However, after that, an-an+1 value has been had no huge change which means that difference is close to 0. Apply Here is a proved formula a= a2=1+a a2-a-1=0 Use quadratic equation a= = 1.618033989 or -0.6180339887 However, the root cannot be the negative number So, ? 1.618033989 Consider another infinite surd where the first term is Repeat the entire process above to find the exact value for this surd. ==1.847759065 ==1.961570561 ==1.990369453 ==1.997590912 ==.1999397637 ==1.999849404 ==1.999962351 ==1.999990588 ==1.999997647 ==1.999999412 According to the result, you can aware that = Then

Logarthimic Patterns
=- Describe how to obtain the third answer in each row from the first two answers. Create two more examples that fit the pattern above. In order to obtain the answer of the third logarithm, the product of the first and second logarithms must be divided by the sum of the answers of the first and second logarithms. Two other examples that fit the pattern above: Let and . Find the general statement that expresses , in terms of c and d. The general statement that expresses is: To test this statement substitute the values of a, x, and c for the values a= 2, b=4, and x= 256: Thus, Scopes and/or limitations of a, b, and x . a > 0, b > 0 The base of a logarithmic equation has to be greater than zero thus, a has to be greater than 0 and b has to be greater than 0. 2. ab1 The base of a logarithmic equation cannot be one because any argument to the base 1 is undefined. If you take an equation such as and by using the change of base formula we get . The natural log of 1 is 0, thus this equation is undefined because the denominator is 0. For example, If we let a=4 and let b= and let x=64 in the follow logarithmic equations: and , then by substituting all the values of a, b, and x we get: . Thus, by using the equation , and substituting the

Function Transformation Investigation
Graph Transformations Note: The arguments of trigonometric functions are done in radians. A function, in mathematics, is an expression that, from an input number, outputs another number that is nearly always influenced by the input one. An interesting attribute to a function is that it can be graphed on a plane. A graph is represented on a 2d plane or Cartesian plane when the function has 1 input variable. Functions can also have more than 1 input variable, but are not graphed on a 2d plane. For example a graph with two input variables is represented on a 3d plane. Only functions with 1 input variable (therefore represented on a 2d plane) will be examined. To understand how a function is graphed, let's have a look at these common functions and their corresponding graphs: Graph of Graph of Graph of Graph of Graph of Graph of Here are some graphs of more complicated functions: Graph of Graph of The last two graphs are similar in shape to previous graphs. The first graph has the same shape as the previously seen. The only noticeable difference is that a translation of has been applied to the first graph producing the graph of. We can see this by comparing the two graphs on the same plane: The blue graph is and the red one is. (-5; 0) - (0; 0) = (-5; 0) and (-8; 9) - (-3; 9) = (-5; 0) We can verify this at larger scales, to ensure that this is

A logistic model
IB Mathematics HL Type II Portfolio: Creating a logistic model International School of Helsingborg - Christian Jorgensen Creating a logistic model Christian Jorgensen IB Diploma Programme IB Mathematics HL Portfolio type 2 Candidate number International School of Helsingborg, Sweden IB Mathematics HL Type II Portfolio: Creating a logistic model International School of Helsingborg - Christian Jorgensen Theory A logistic model is expressed as: un?1 ? run {1} The growth factor r varies according to un. If r=1 then the population is stable. Solution . A hydroelectric project is expected to create a large lake into which some fish are to be placed. A biologist estimates that if 1x10⁴ fish were introduced into the lake, the population of fish would increase by 50% in the first year, but the long-term sustainability limit would be about 6 x10⁴. From the information above, write two ordered pairs in the form (u0, r0), (u0, r0) where Un=6x10⁴. Hence, determine the slope and equation of the linear growth in terms of Un As Un =6 ?104 , the population in the lake is stable. Thus from the definition of a logistic model, r must equal to 1 as un approaches the limit. If the growth in population of fish (initially 1 ?104 ) is 50% during the first year, r must be equal to 1.5. Hence the ordered pairs are: (1?104 , 1.5) , (6 ? 104 , 1) One can graph the two ordered

Logan's logo
Math Portfolio Type 2 Logan's Logo Name: Mena Nadum Class: IB07 Introduction Logan has designed the logo at the right. The diagram shows a square which is divided into three regions by two curves. The logo is the shaded region between the two curves. Logan wishes to find mathematical functions that model these curves. Now in order to find this mathematical function, the square needs to be measured by placing it on a graph paper (figure 2) and then the data points must be identified and recorded to represent a model function for each of the curves. I have decided to choose my units in cm. Figure 1 From this simple plot we can estimate and examine a proper set of axes and record the coordinates in each curve. Bellow there is table1 to show the data points that the curve lower (inferior) curve and table2 to show the data points that the upper (superior) curve follows. Figure2 Table1 X f(x) 0 0.7 0.5 0.4 0.8 0.35 0.4 .5 0.6 2 2.5 .4 3 2 3.5 2.55 4 3.15 4.5 3.65 5 4.05 5.5 4.23 6 4.17 6.5 3.8 7 3.15 7.5 2.1 Table2 u f(u) 0 2.5 0.3 .9 0.5 .5 .05 .5 2 .2 2.5 .7 3 2.4 3.5 3.25 4 4.2 4.5 5 5 5.7 5.5 6.3 6 6.55 6.3 6.6 6.5 6.5 7 6.1 7.5 5.1 Variables: * x represents any data point on the x-axis in the domain (0-7.5) which stand for the lower curve * f(x) is the image for all the values of x and is