This kind of reciprocal interaction of factors can be observed in many areas of psychological interest. Study of clinical depression is one of them. Depression is sometimes believed to have a genetic origin (Toates, 2002). Studies of isolated traditional family communities, like the Amish in the USA, have shown that manic depression runs in families (Hayes, 2000). On the basis of these studies, a claim about genetic inheritance of depression has been made. However, as Hayes (2000) suggests, this kind of organic causes of depression are questionable for two reasons. Firstly, the diagnosis frequently relies on accounts and memories about people who are no longer alive. These accounts often tend to ignore the ordinary, quiet events and pinpoint the intense and upsetting ones, thus generally becoming exaggerated. Secondly, factors attributed to biology often can be social in origin. It is very possible for children to see, consciously or not, certain extreme emotional responses of their parents as an appropriate type of behaviour and subsequently adopt it themselves. Even presuming the organic root of depression, individuals with suspected high risk of developing it may not inevitably do so as positive life circumstances and influence of others may prevent this from happening . Conversely, those with high genetic bias towards depression may experience it due to many stressful life events (Toates, 2002). Brown and Harris (1978, cited by Hayes 2000), who studied a large sample of London housewives, found that development of depression can be influenced by a number of social and cultural factors, such as social isolation or lack of emotional support. It could be argued that we can judge whether depression of an individual is in-born or environmentally-based by looking at their ability to recover from it when the negative external influences have been withdrawn. However, as Seligman (1975, cited by Hayes 2000) argues, depressed individuals often display the effects of learned helplessness where as a result of prolonged exposure to the situation which they were unable to change, they fail to take any action even when their circumstances have changed.
Clinical neuropsychology is an area of psychology with a great scope for benefiting from biological and physiological knowledge. Clinical neuropsychologists try to draw conclusions about how the brain functions by, amongst other methods, using information from people who have experienced brain damage (Hayes, 2000). One of the most famous cases of an accidental brain damage has been that of railway worker, Phineas Gage, in 1848 (Toates, 2002). Gage suffered a dramatic injury as a large piece of tamping iron had blown right through the frontal lobe section of his brain. Remarkably, Gage has survived but his personality was subsequently changed very significantly. The Gage’s case has been re-evaluated as the more recent research revealed an evidence about the role of the frontal lobes in controlling of emotional expression. Moniz (1936, cited by Hayes 2000) observed that chimpanzees who had undergone surgical removal of the frontal lobes have become more passive and obedient. Subsequently, he suggested that these areas of the brain are responsible for aggression and socially undesirable behaviour. Knowledge about many other mental functions, such as learning, memory or language acquisition has been advanced thanks to the techniques available within the brain studies. These studies are, however, a very tricky activity, as the brain cannot be observed directly and it is a very complex structure where many different parts work together to produce a certain effect. Here again the impact of the person’s social and physical experience cannot be ignored.
As it can be seen from the above examples, knowledge about biological processes, if considered in isolation, can be somehow limited in providing conclusive psychological explanations. Research findings which originally encouraged seemingly straightforward reductionist claims prompted further questions to which answers were not always searched within the realm of biology. Although the emphasis of this essay has been to evaluate the role of biological knowledge in supporting psychological explanations, it was impossible to achieve this without exploring the wider context of the two-way interaction of biological and social influences. The relationship between these influences is reciprocal and the role of biological knowledge can be only truly estimated from the perspective of its complementary character.
The total number of words: 1,090.
References
Hayes, N. (2000) Foundations of Psychology, 3rd ed., London, Thomson Learning.
Toates, F (2002) Biological processes and psychological explanation, in Miell, D., Phoenix, A. and Thomas, K. (eds) Mapping Psychology, Milton Keynes, The Open University.
Part II: SPSS exercises
Question 1
i
-
Experimental hypothesis – It is predicted that extraverts will drive faster than introverts.
-
This experimental hypothesis is a one-tailed hypothesis. The researcher in this study predicts in which direction the IV (the personality of the participant) will affect the DV (the participant’s driving speed).
- I have chosen the one-tailed hypothesis because the prediction of this study relates to the earlier research of Eysenck and uses the psychometric test for measuring personality designed by him (Eysenck,1967, cited by Thomas 2002). The prediction proposes that the participants with high extraversion scores on the Eysenck Personality Questionnaire (Eysenck,1967, cited by Thomas 2002) will seek to increase their arousal levels by driving quickly as opposed to the participants with high introversion scores who will seek to decrease their arousal levels by driving more slowly. In other words, the researches in this study assumed that the fast driving speed will have an arousing effect on the participants’ behaviour and will be more likely applied by the extraverts than the introverts. This assumption suggests that one-tailed hypothesis will be more appropriate to use than the two-tailed hypothesis, which would be not sufficient to express the type of relationship between the driving speed and the participant’s personality and allow to make a much more vaguer prediction.
-
The null hypothesis – There will be no relationship between personality and driving speed.
ii
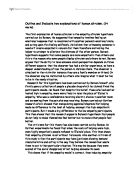
Chart 1 Error bar chart
Average speed (mph) achieved by introverted and extroverted students
iii
The introverted personality sample mean is 26.80. The 95 per cent confidence interval for the introverted sample mean is 26.80 ± 2.54 (the lower bound = 26.80 – 2.54 = 24.26; the upper bound = 26.80 + 2.54 = 29.34). This means that the researchers are 95 per cent confident that the population mean will fall between 24.26 and 29.34. The extroverted sample mean is 29.70. The 95 per cent confidence interval for the extroverted sample mean is 29.70 ± 2.36 (the lower bound = 29.70 – 2.36 = 27.34; the upper bound = 29.70 + 2.36 = 32.06). Therefore, the researchers are 95 per cent confident that the population mean will fall between 27.34 and 32.06. As the experimental hypothesis predicted, the introverted participants’ average driving speed is lower than that of the extroverted participants’. As it can be seen from the chart, the confidence intervals partly overlap, which may suggest that the observed difference is due to the sampling error. However, one-tailed p-value is 0.037, which is less than 0.05 suggesting that the difference between the sample means is statistically significant (not due to the sampling error). The measure of effect size, which is the difference between two means expressed in terms of standard deviation, known as the statistic ‘d’, is 0.07. This can be considered a large effect, suggesting that the difference between the samples is due to actual differences between introverts and extroverts.
Question 2
Chart 2
Mean number of emotions classified correctly for each of three cultures
Chart 3
Comparative number of emotions classified correctly for each of three cultures
Chart 4 Error bar chart
Mean number of emotions classified correctly for each of three cultures
Descriptive statistics table
As it can be seen from the Chart 2, the Chart 4 and the descriptive statistics table, the mean number of emotions classified correctly by the UK’s participants is 10.70. Three UK participants classified all 12 emotions correctly. The median score is 10.50. By looking at the Chart 3 we can see that the most frequently (4 times) occurring value, the mode, is 10. The range of scores is 3 (12 – 9), with 9 being the lowest score of the UK sample. The standard deviation, the average deviation of each score from the mean score, is approximately 1. The 95 per cent confidence interval for the UK sample mean is 10.70 ± 0.76, so we can be 95 per cent confident that the population mean value will fall between 9.94 and 11.46.
The mean number of emotions classified correctly by the Japanese participants is 9.2. The highest score, achieved by two Japanese participants, was 11. The median score is 9 and the mode is 8 (occurred 4 times). The range of scores is 3 (11 – 8), with 8 being the lowest score of this sample. The standard deviation is 1.2. The 95 per cent confidence interval for the Japanese sample mean is 9.20 ± 0.88, so we can be 95 per cent confident that the population mean value will fall between 8.32 and 10.08.
The mean number of emotions classified correctly by the Chilean participants is 7.4. Only one participant correctly classified all 12 emotions. The median score is 8 and the mode is 8 and 4 (both occurring 2 times). The range of scores is 9 (12 – 3), with 3 being the lowest score of this sample. The standard deviation is 3.2. The 95 per cent confidence interval is 7.40 ± 2.29, so we can be 95 per cent confident that the population mean will fall between 5.11 and 9.69. Wide dispersion of Chilean scores is reflected in the values of the standard deviation and the confidence interval.
As it can be seen from the Chart 2, the Chart 4 and the descriptive statistics table, the UK sample has the highest mean, median and mode scores of correctly classified emotions. The UK sample has also the highest number of participants who classified all 12 emotions correctly. By contrast, the Chilean sample has the lowest mean, median and mode scores. The Chilean sample is characterised by a wide range of scores with one score of 12 but also one score of as low as 3 and couple of scores of 4. Scores of 3, 4 and 5 are the lowest scores of the study and occur only in the Chilean sample. The Japanese sample, with scores slightly lower than those of the UK sample but generally higher and not as widely dispersed as those of Chilean sample, lays in the middle. The error bar chart for all the samples shows the overlap of the Japanese sample confidence interval with the Chilean sample confidence interval, from which we could conclude than any differences between them are due to the sampling error. This overlap is a consequence of large dispersion of the Chilean sample. The findings related to this sample could be explored and evaluated by a further study involving a larger sample.
References
Thomas, K (2002) The individual differences approach to personality, in Miell, D., Phoenix, A. and Thomas, K. (eds) Mapping Psychology, Milton Keynes, The Open University.