Apple and Microsoft Company Analysis
Apple and Microsoft Company Analysis
Contents
.0 Introduction.................................................................................4
1.1 Objectives...........................................................................4
1.2Methodology.........................................................................4
1.3 Structure..............................................................................5
2.0 Apple Computers Inc .......................................................................6
3.0 Microsoft......................................................................................6
4.0 Share Price fluctuation.......................................................................7
5.0 Company Value...............................................................................7-8
6.0 Total Revenue.................................................................................9
7.0 Apple Pest Analysis........................................................................10-11
8.0 Recommendation...........................................................................12-13
9.0 Appendices..................................................................................15-19
Executive Summary
The objectives of this report are to research two companies in this case Microsoft and Apple and provide graduates with a recommendation on one ore both organisations.
It was concluded that although financial information is important when considering a job other factors also have a bearing such as job satisfaction and interest in the area/department the graduate wants to work in There is no correct decision to be made although both companies are financially secure Microsoft offer better job security and a possible better financial package due to their larger turnover and greater market share. When choosing between the two companies its all down to what the graduate requires. If job security and financial factors are important and the employee does not mind being a small cog in a big machine then they should choose Microsoft. If the graduate prefers to work solely for the IT industry and is interested in the design / multimedia then they should choose Apple.
.0 Introduction
The following report provides analysis on two high profile companies within the computing industry. The two organisations chosen for this assignment are Microsoft and Apple. This report aims to provide graduates considering working in the computing industry with a clearer view on what each company entail. This report also aims to provide information on each company such as turnover, Company Value, political analysis, environmental analysis, social analysis and technological analysis of the industry with reference to theoretical and analytical models. This should help the graduate chose which company suits them better.
.1 Objectives
The objectives of this report are to;
* Research Apple and Microsoft
* Analyse the data regarding the two organisations
* Recommend an organisation to a graduate
.2 Methodology
This report is based on the research of Apple and Microsoft, both of which apply trade in the computing industry. The information used for this report is mainly secondary information such as the Internet, books and journals. No primary research was carried out.
.3 Structure
The structure of this report is as follows:
.0 Introduction
2.0 Apple Computers Inc
3.0 Microsoft
4.0 Share Price fluctuation
5.0 Company Value
6.0 Total Revenue
7.0 Apple Pest Analysis
8.0 Recommendation
2.0 Apple Computers Inc
Apple Computers Inc is an Information technology company they apply their trade in the IT segment of the market. Apple is unique in the sense that they are the only company in the computing industry that design and manufacture the entire personal computer from the hardware inside the personal ...
This is a preview of the whole essay
.3 Structure
The structure of this report is as follows:
.0 Introduction
2.0 Apple Computers Inc
3.0 Microsoft
4.0 Share Price fluctuation
5.0 Company Value
6.0 Total Revenue
7.0 Apple Pest Analysis
8.0 Recommendation
2.0 Apple Computers Inc
Apple Computers Inc is an Information technology company they apply their trade in the IT segment of the market. Apple is unique in the sense that they are the only company in the computing industry that design and manufacture the entire personal computer from the hardware inside the personal computer to the operating system. This provides a unique experience for the user as the operating system has been designed around the hardware and greater performance from the personal computer is achieved.
Apple provides a vast range of products such as the Power MacG4, PowerBook, iMac, eMac, iBook and the iPod which is apart of their latest venture into the portable audio market.
3.0 Microsoft
Microsoft is also a computer company and applies most of their trade in the IT segment
Being in the IT industry Microsoft are motivated and inspired by how customers use their software to find solutions to business problems. Microsoft attempts to run its business in the same way.
Microsoft's core business is in the selling of computer peripherals and software products such as Home and Business operating systems and word processing packages. They also develop computer games and have recently acquired market share in the computer console market via its latest product the Microsoft Xbox.
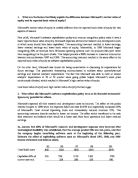
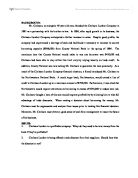
4.0 Share Price fluctuation
Shares in Microsoft are very stable; they tend to take small dips and rises but generally are stable. Apple's shares on the other hand tend to fluctuate a lot more, for example in May 2003 they took a big rise almost 20% but then in July they dropped slightly.
If a graduate was to check the performance of the company via shares then he would notice that Microsoft are a more stable company whereas Apple tend to fluctuate but generally are rising which shows potential. This may also indicate that Apple is still a growing company whereas Microsoft is just maintaining its market share.
A job at Microsoft would give the graduate better job security as the company seem more stable on the other hand working for Apple may include better promotional prospects as the company are still growing and new job positions may become available also the employees have more chance of receiving a bonus due to the current spurts of growth which result in more turnover.
5.0 Company Value
The following section compares the company value of Apple and Microsoft using net asset figures used from appendix 2 and 3.
Microsoft's company value is far greater then that of Apple's. Microsoft's company value in September 03 was $36,262,000
(Net tangible assets - current liabilities)
$50,019,000 - $13,757,000 = $36,262,000
Where as Apple's company value in September 03 was 2,318,000:
(Net tangible assets - current liabilities)
$3,976,000 - $1,658,000 = $2,318,000
That is a difference of $33,944,000; this compares the difference in size and value of the companies. Microsoft is a lager company by far and makes a lot more money. This could be because Microsoft competes in more than one market for example they have branched off from the software market and created a new product named the Xbox for the computer console market. Apple are also trying do diversify their product range with the introduction of the iPod into the portable audio market but they are still along way of form achieving the scale Microsoft have done this on.
6.0 Total Revenue
Microsoft's total revenue for the last three quarters is shown below:
September 2002
December 2002
March 2003
7,746,000
8,541,000
7,835,000
As shown above Microsoft's revenue is very consistent much like their shares. This shows a graduate that Microsoft have good job security, because they are continually making a profit on a regular basis, this leads to Microsoft being able to offer their employees peace of mind which may result I a better working environment.
Apple's total revenue for the last three quarters is shown below:
September 2000
September 2001
September 2002
786,000
(25,000)
65,000
Apples profit tends to fluctuate, as you can see in September 2000 profits are at a high but then in September 2001 they have made a loss of $25,000. This would worry a potential graduate because the revenue fluctuates the employees may not feel that their jobs are secure, this in turn will effect the working environment and employees may fear redundancy.
7.0 Apple Pest Analysis
The following model lists Apples Political, Economical, Social and Technological issues.
Political
* Anti-American supporters due to the war (may boycott American products)
* Copy write laws could be changed.
* Tax laws could be changed.
Economical
* Strength of the US Dollar.
* Import and export taxes.
* Pricing strategy compared to competitor e.g. Microsoft could undercut apples prices
* Interest rates may cause consumers to have less disposable income; therefore they will not be able to afford to buy luxuries.
* Cost of current technology (Research and development).
* Availability of hardware and software.
Social
* Software piracy could damage sales
* War in Iraq, people may boycott American products.
* Technophobes, people who are afraid of technology
* Level of social acceptability.
Technological
* Advances in computer hardware, what maybe good today could be obsolete tomorrow.
* Rise in the complexity of other software products forcing Apple to apply them to.
* Technological advances may prevent sales in other countries where the technology is not so up to date
* Faults (bugs) in past software.
8.0 Recommendation
Both companies are giants in the computing industry but when a graduate is faced with a decision between the two then the following factors should be considered as stated in the report
Share Price fluctuation
As stated in the report Microsoft shares are stable whereas Apples are fluctuating, this is due to the company growing whereas Microsoft are already maintaining their huge market share. This information provides the graduate with many options, they could take a job with Microsoft and ensure Job security or take a risk with Apple, with the opportunity to achieve more because as the company grows more jobs higher up will become available enabling the graduate to possibly achieve more.
Total Revenue And Company Value
As stated in the report Microsoft is the larger of the two companies by far, this is shown in assets, there is a difference of $33,944,000, this figure shows Microsoft operate on a much larger scale to that of Apple. A graduate would have to consider if they want to be a small cog in a big machine (Microsoft) or if they want to have more creative influence on a company (Apple).
Although financial information is important when considering a job other factors also have a bearing such as job satisfaction and interest in the area/department the graduate wants to work in. Apple mainly focus their business on multimedia and design whereas Microsoft are more corporate, this could also be a deciding factor between the two companies
There is no correct decision to be made although both companies are financially secure Microsoft offer better job security and a possible better financial package due to their larger turnover and greater market share. When choosing between the two companies its all down to what the graduate requires. If job security and financial factors are important and the employee does not mind being a small cog in a big machine then they should choose Microsoft. If the graduate prefers to work solely for the IT industry and is interested in the design / multimedia then they should choose Apple.
Bibliography
Internet sites used
www.yahoo.com/finance
www.microsoft.com
www.apple.com
http://www.apple-histroy.com
http://www.infoworld.com/
www.be.com
Book Used
The Strategic Management Of Organisation
A Haberberg & A rieple
ISBN: 0-130-21971-0
Business Studies - Second Edition
Dave Hall, Rob Jones and Carlo Raffo.
ISBN - 1-873929-90-0
Appendix 1
Figure 1
Microsoft's share fluctuations compared to Apple's
Figure 2
Apple's share fluctuations compared to Microsoft's
Appendix 2
Microsoft's Balance sheet
Assets
Current Assets
Cash And Cash Equivalents
6,438,000
4,300,000
5,552,000
5,338,000
Short Term Investments
42,610,000
41,878,000
37,872,000
35,137,000
Net Receivables
7,702,000
6,332,000
7,241,000
6,851,000
Inventory
640,000
604,000
650,000
959,000
Other Current Assets
,583,000
,558,000
,616,000
,758,000
Total Current Assets
58,973,000
54,672,000
52,931,000
50,043,000
Long Term Investments
3,692,000
3,052,000
2,647,000
3,580,000
Property Plant and Equipment
2,223,000
2,208,000
2,257,000
2,189,000
Goodwill
3,128,000
2,782,000
2,757,000
2,855,000
Intangible Assets
384,000
575,000
607,000
642,000
Accumulated Amortization
-
-
-
-
Other Assets
,171,000
,193,000
895,000
926,000
Deferred Long Term Asset Charges
-
-
265,000
-
Total Assets
79,571,000
74,482,000
72,359,000
70,235,000
Liabilities
Current Liabilities
3,974,000
3,161,000
3,617,000
3,757,000
Accounts Payable
5,033,000
4,985,000
5,356,000
5,347,000
Short/Current Long Term Debt
-
-
-
-
Other Current Liabilities
8,941,000
8,176,000
8,261,000
8,410,000
Total Current Liabilities
3,974,000
3,161,000
3,617,000
3,757,000
Long Term Debt
-
-
-
-
Other Liabilities
2,846,000
2,670,000
2,930,000
2,810,000
Deferred Long Term Liability Charges
,731,000
369,000
-
52,000
Minority Interest
-
-
-
-
Negative Goodwill
-
-
-
-
Other Assets
,171,000
,193,000
895,000
926,000
Deferred Long Term Asset Charges
-
-
265,000
-
Total Liabilities
8,551,000
6,200,000
6,547,000
6,719,000
Stockholders' Equity
Misc Stocks Options Warrants
-
-
-
-
Redeemable Preferred Stock
-
-
-
-
Preferred Stock
-
-
-
-
Common Stock
35,344,000
34,332,000
33,605,000
33,013,000
Retained Earnings
25,676,000
23,950,000
22,207,000
9,920,000
Treasury Stock
-
-
-
-
Capital Surplus
-
-
-
-
Other Stockholder Equity
-
-
-
583,000
Total Stockholder Equity
61,020,000
58,282,000
55,812,000
53,516,000
Net Tangible Assets
$57,508,000
$54,925,000
$52,448,000
$50,019,000
Appendix 3
Apple's Balance sheet
Assets
Current Assets
Cash And Cash Equivalents
3,507,000
3,410,000
2,612,000
2,252,000
Short Term Investments
,038,000
,116,000
,850,000
2,085,000
Net Receivables
744,000
660,000
674,000
731,000
Inventory
38,000
41,000
44,000
45,000
Other Current Assets
219,000
241,000
204,000
275,000
Total Current Assets
5,546,000
5,468,000
5,384,000
5,388,000
Long Term Investments
-
-
28,000
39,000
Property Plant and Equipment
639,000
619,000
605,000
621,000
Goodwill
85,000
85,000
85,000
85,000
Intangible Assets
27,000
29,000
31,000
34,000
Accumulated Amortization
-
-
-
-
Other Assets
44,000
60,000
36,000
31,000
Deferred Long Term Asset Charges
-
-
-
-
Total Assets
6,441,000
6,361,000
6,269,000
6,298,000
Liabilities
Current Liabilities
2,025,000
2,007,000
,595,000
,658,000
Accounts Payable
,718,000
,697,000
,595,000
,658,000
Short/Current Long Term Debt
307,000
310,000
-
-
Other Current Liabilities
-
-
-
-
Total Current Liabilities
2,025,000
2,007,000
,595,000
,658,000
Long Term Debt
-
-
320,000
316,000
Other Liabilities
-
-
-
-
Deferred Long Term Liability Charges
218,000
215,000
238,000
229,000
Minority Interest
-
-
-
-
Negative Goodwill
-
-
-
-
Other Assets
44,000
60,000
36,000
31,000
Deferred Long Term Asset Charges
-
-
-
-
Total Liabilities
2,243,000
2,222,000
2,153,000
2,203,000
Stockholders' Equity
Misc Stocks Options Warrants
-
-
-
-
Redeemable Preferred Stock
-
-
-
-
Preferred Stock
-
-
-
-
Common Stock
,935,000
,919,000
,840,000
,826,000
Retained Earnings
2,350,000
2,331,000
2,317,000
2,325,000
Treasury Stock
-
-
-
-
Capital Surplus
-
-
-
-
Other Stockholder Equity
(87,000)
(111,000)
(41,000)
(56,000)
Total Stockholder Equity
4,198,000
4,139,000
4,116,000
4,095,000
Net Tangible Assets
$4,086,000
$4,025,000
$4,000,000
$3,976,000