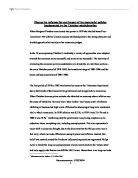
The budget is the main instrument for the government’s fiscal policy. Money is raised by way of taxes and loans, and then allocated to expenditure for the year. Governments plan and control their fiscal affairs through the budget whilst introducing taxes to raise money for future expenditure. Introducing taxes into an income-expenditure model forces us to be more careful with the assumption we make about consumption. Realistically, people should base consumption decisions not on total income, but on disposable income (disposable income being the amount left after taxes). The addition of government spending and taxes gives government a role in determining the level of national income. When government increases its spending, income rises because output increases. When government increases taxes, expected disposable income decreases, and people reduce consumption. Through the multiplier process, which dictates that a change in either output or input creates a situation whereby equilibrium needs to be established, national income falls by a multiple of the change in taxes. The use of changes in government spending or taxing with the goal of changing national income is called fiscal policy. Graphically illustrated, with the Circular Flow of funds diagram, the government’s role as an active participant in the economy can be describe as follow:
Figure 2.1 Circular flow of funds.
Traditionally, governments have tried to balance their budgets, i.e. spending had to be equal to revenue in order to ensure that the budget’s effect on the economy would be as neutral as possible. However, it has become acceptable for governments to use the budget as a policy instrument to stabilise the economy, along the lines of Maynard Keynes theory that “governments could intervene in the economy and affect the level of output and employment” (Case & Fair, 2003:376). In times of a recession the budget can be used to stimulate the economy as well as a tool to slow down the economy when there is full employment with threatening inflation and possible balance-of-payments problems. A good example would be to drop the interest rates to stimulate economic growth and put more money in the pockets of the people.
2.2 Economic Objectives
The 2004 budget can be described as a consolidation budget building on the political and economic achievements of the last decade. It is unambiguously pro-growth and pro-poor, but not at the expense of fiscal sustainability (Standard Bank, 2004:1) The allocation of funds in this budget reflects the government’s intention to balance investments in people, infrastructure and provision of income support for poor and vulnerable people.
Two months before the 3rd general election, the Minister provided R4 billion in tax cuts aimed predominately at low-income earners, notwithstanding the Budget deficit of 2003. The minister also provided business with the opportunity to consolidate their tax affairs during 2004/2005 whilst a working group will review the compliance burden they face. There were no major surprises in the budget but it was prepared with the important proposals that provide a map to direct the ongoing future economic growth and development of South Africa. The 2004 budget among other objectives is design to achieve the following:
- An expanded public works program that will create one million jobs over a period of 5 years, hence the additional allocation to municipalities and provinces, which will be the main vehicle driving the implementation of the program. In addition the program seeks to equip people with skill to sustain themselves beyond this program.
- Strengthening of health system to help living with HIV and Aids.
- Increasing the number of policewomen and men to 150 000.
- Accelerating the transfer of land to thousands of landless citizens.
- Providing more school material to poor schools and uplifting their standard of education.
- Roll out of the child support grant to children up to the age of 14.
- Providing money for food relief and for the effects of drought.
- Building and repairing roads, bridges, rail, ports, schools, community centres, airports, water and sanitation networks and homes.
- Improving service delivery level and quality in general.
2.3 Global Trends
In the past 10 years, uncertainty in international economic growth resulted in volatility in commodity prices and financial markets. Emerging markets have been the most vulnerable to financial market turbulence, as seen in Mexico in 1994, Brazil and Russia in 1995, East Asia in 1997 and Argentina in 2000. The latter part of 2002 remained challenging for emerging markets. Government policy on trade seeks to provide a healthy environment for trade by gradually removing the barriers that inhibit trade between South Africa and other countries. By removing these barriers they hope to encourage trade with foreign importers and establish more favourable exporting opportunities. Removal of trade barriers will also open up the international market to South Africa’s goods and services and serve to increase the much- needed exporting rights. Trade can be beneficial to both countries if a situation exists whereby a product or service can be imported for a price cheaper than it can be produced. However, in certain instances the government can institute trade barriers through internal subsidisation or import tariffs. The rationale behind this move is said to protect certain industries from massive unemployment and other economic hardships like in the case of ISCOR.
2.4 Balance of payments
The balance of payments is the record of transactions in goods or services with the rest of the world measured in US Dollar. Internationally, the balance of payments statistics equals zero because some use is found for each unit of foreign exchange provided, and each unit of foreign exchange used has a source.
To estimate the gap between supply and demand, the government first attempts to measure all the uses and all the sources of foreign exchange. South Africa’s balance of payment remains healthy. The current account of the balance of payments is expected to record a small surplus but with buoyant economic growth, and the influence of the strong exchange rate, it is expected that the current account will move into a moderate deficit of 1,3% of GDP in 2004.
2.5 Economic growth in South Africa
South Africa can still be classified as a developing country. Developing countries often are confronted by economic problems quite unique from those faced by developed countries.
To cite a few of these problems namely;
- Stagnating salaries, which only provides for basic necessities.
- Lack of sound economic management system.
- Chronic shortage of basic food supplies i.e. starvation.
- High population growth.
- AIDS and other incurable or debilitating diseases
Life in developing countries is simply a continual struggle; the circumstances of poverty, prospects of dramatic impoverishment and living standards for most are quite bleak. Poverty, not affluence, pervades developing worlds. Developed worlds consume more compared to developing worlds because of insufficient income or income disparities between the rich nations and poor nations.
Factors that limit poor nation’s economic growth
- Insufficient capital formation
- Shortage of human resources and entrepreneurial skills
- Lack of social overhead capital
- Dependency syndrome on developed nations.
Low levels of output are due to insufficient quantities of necessary inputs. The scarcity of physical capital constrains labour productivity and holds back national output. The vicious circle of poverty, which is self-perpetuating, makes savings impossible. Lack of savings or investment incentives and the issue of brain drain rob most developing countries of their true potential to grow.
The government has attempted through the two important socio-economic plans: RDP and GEAR to address those issues that hampers economic growth in South Africa. The two strategies emphasise mainly on the need to invest in people, because long-term development and the reduction of poverty can best be achieved by empowering people to cater for their own needs and desires. Significant progress had been made in alleviating poverty and reducing hardships. For instance,
- The number of children attending schools increased with 10% from 1994
- Daily meals are being provided to 5 million primary schoolchildren
- 700 new clinics have been built
- 1 million women and children in rural areas have been given access to clean water
- 1,5 million homes has been connected to electricity supply.
The 2004 budget provides sufficient allocation of funds to these areas that are of concern as depicted above.
3. Government Policies
3.1 Fiscal Policy
In somewhat general terms, an economic policy aims to find satisfactory solutions to various stumbling blocks, which may crop up from time to time in any economic system. These hurdles are:
- inflation
- balance of payments problems
- unsatisfactory economic growth, and
- unemployment
It is difficult to find solutions to these problems, but policy decisions become even trickier when the importance of the problems changes over time. For instance, during the second half of the 1980’s and early 1990’s, South Africa was plagued by persistently high levels of inflation. At the same time, our economic growth was far from satisfactory. In order to curb inflationary problems, economic policy had to be aimed at slowing down economic activity so as to reduce the demand for goods and services. As a result interest rates were raised. These measures also prevented the economy from growing as fast as it might have. And if the economy does not grow unemployment rises. Government uses two methods i.e. fiscal policy and monetary policy to achieve this deliberate action taken by them to influence the economy by changing the level of government expenditure and taxes. In the event of reduced economic activity and large-scale unemployment, an expansionary fiscal policy would probably be adopted. This entails increasing government spending and/ or providing some sort of tax relief. This trend can clearly be seen in the 2004 budget. Higher government spending boils down into the economy, while tax relief means that the government is taking less money away from households and businesses, which should stimulate spending. It is clear that the government is following an expansionary fiscal policy. The only bottleneck currently is the high unemployment rate that was not aggressively addressed in the 2004 budget.
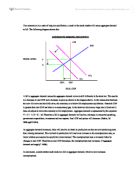
The above-mentioned theory can be illustrated with the aid of the Government spending multiplier.
Figure 3.1: Government spending multiplier.
3.1.1 Nature and goals of fiscal policy
Following a decade of structural economic change and comprehensive transformation of public services, the priority now is to accelerate the pace and broaden the scope of development in the years ahead.
Nothing in macroeconomics or microeconomics arouses as much controversy as the role of government in the economy (Case & Fair, 2003:455). Decisions of money and resource distribution by government are embodied in the fiscal policy. Fiscal policy can be defined as national government decisions regarding the nature, level and composition of government expenditure, taxation and borrowing, aimed at pursuing particular goals (Black, et al., 2003:266). The fiscal policy’s main goal is to see a strong growth in social spending and infrastructure investment, a stable tax burden relative to GDP and declining debt service costs. Out of the highlights above the fiscal policy goals for 2004/2005 from high to low priority i.t.o fund allocation are:
- BEE initiatives development
- Poverty alleviation
- Expanded public works program that include public service upgrades
- Land reform
- Fight against crime
- HIV and aids treatment programs.
The emphasis is more on public spending and public private partnerships to contribute to capital formation and maintenance of public assets. The above goals can further be broken down into sectoral goals and micro goals. Sectoral goals would include the development of a specific sector such as education that received the highest increase as depicted in the above summary. Micro goals would include the combating of crime and poverty as well as to pursue goals in a particular geographical area such as the expanded public works program to improve services to citizens especially in the rural areas of the country. Applying fiscal policy alone does not pursue the above fiscal policy goals. Other policies, such as the monetary policy, trade and industrial policy, competition policy and labour policy, also influence the achievement of the fiscal policy goals.
3.1.2 Instruments of fiscal policy
If we look at the goals identified, a clear distinction between macro and micro instruments of fiscal policy can be made. In macro terms the instruments include total government expenditure, the economic categories of consumption and capital expenditure, the total tax amount, the budget deficit and the way in which the deficit is financed (Black, et al., 2003:268). In simple terms the micro fiscal terms or sectoral terms are the various expenditure functions of the government.
3.1.3 Fiscal policy trends and targets
Against the background of the fiscal consolidation achieved over the past decade – expenditure reprioritisation, a lower budget deficit, improved management of public debt, lower interest rates and a buoyant tax structure – the 2004 budget aims to invigorate the recovery evident in the last quarter of 2003 while continuing to build on the foundations for long-term growth and development. One identified weakness of fiscal performance since 1994 is expenditure on fixed capital. This however, turned around in 2002 and in 2004 there will be a significant increase in borrowings specifically in the public sector. Public-private partnership projects are also now contributing significantly to capital formation and maintenance of public assets.
For the period ahead:
- General government capital formation is targeted to grow by 6% per year.
- Government consumption expenditure will stabilise at about 19% of GDP, with growth mainly focussed on non-wage spending.
- Transfers to households, mainly social grants, are projected to rise from 3,2% of GDP in 2001/02 to 4,8% in 2006/07.
- General government tax revenue remains below 25%.
- Interest on public debt is expected to decline from 4,9% of GDP in 2002 to 4,2% in 2006.
The public sector borrowing requirement, which takes into account borrowing by non-financial public enterprises, such as Eskom, Telkom and the Post Office, in addition to borrowing by national government, provinces and municipalities, is expected to increase from 0,6% of GDP in 2002/03 to 3,2% in 2004/05, before easing to 2,7% in 2006/07. The increase in public sector borrowing requirement takes account of increasing infrastructure investment by public enterprises.
3.1.4 The effectiveness of fiscal policy
After World War II Keynesian activism elevated fiscal policy to the macroeconomic level. Government was given the responsibility to actively manage (increase and decrease) aggregate demand so that it equals aggregate supply (Black, et al., 2003:270). In recessionary conditions policy-makers should increase government expenditure or reduce taxes, which could increase the budget deficit or change a budget surplus into a balanced budget or a budget deficit. (see graph 3.1 above) In times of economic boom or an over heated economy, the opposite measures are warranted, that is, a decrease in government expenditure or an increase in taxes. Income taxes and unemployment benefits have a stabilising effect on the economy meaning that a change in income would have in impact on the tax revenue.
3.2 Monetary Policy
Monetary policy is a broad concept covering a number of measures implemented by the South African Reserve Bank to achieve its economic objectives. These objectives are regulating price fluctuations (in other words, controlling inflation), the balance of payments, the international value of the Rand, and employment. The idea is that by stabilising the short-term performance of these variables, monetary policy creates the right environment for the economy to grow in the longer term. In an attempt to achieve theses objectives, monetary policy aims to affect the money supply, credit extension by financial institutions to borrowers, and interest rates. As in the case of fiscal policy, monetary policy can be either expansionary or restrictive. If the government is challenged with financing a massive outflow of capital it is essential that current account deficit must be transformed into a surplus. In order to do this domestic spending by consumers and businesses and the government have to be curbed. This is achieved by adopting a restrictive policy status. The reserve bank will implement a number of measures aimed at making bank credit more expensive and more difficult to obtain. A good example is when the prime overdraft rate will go up from say 11% to 25% and stay above 20% for two consecutive fiscal periods. This restrictive (or as it is often called, tight) monetary policy worked. Domestic spending will fall after inflation is taken into account. As a result of this the quantity of goods imported will also reduce. This will help to transform the current account deficit to a healthy surplus. One negative effect of the above can move the economy into a recession. To prevent it from slipping into a recession monetary policy needs to be relaxed by dropping the interest rate. The above concept can be illustrated with the following figure:
Figure 3.2: Money Supply
The quantity of money demanded is a function of the interest rate. Because the interest rate is the opportunity cost of holding money balances, increases in the interest rate will reduce the quantity of money that firms and households want to hold. The opposite will result in firms and households wanting to hold more money (Case & Fair, 2003:509).
The monetary policy committee in 2004 budget reaffirmed that it was unlikely that inflation will be brought within the target range due to long lags between interest hikes and slowing down in inflation. Other events beyond the control of the monetary policy framework also influenced this. The Reserve Bank however does not have an intermediate policy target or guideline and is committed to allow the value of the Rand to be determined by the market.
3.2.1 Monetary Concerns
Some risk factors were identified and could prevent that the CPIX move out of target range (The target being 3-6%). To mention a few risk factors: High rates of increase in the average nominal remuneration in the formal non-agricultural sectors, a slowdown in labour productivity growth, an insecure international environment and an increase in administered prices.
3.2.2 Money supply
Money can be classified as a scarce item. Why do we need money and what is the function of money? One of the greatest potential mysteries surrounding economics is the creation of money. The major source of new money is not the production of new notes and coins by the Reserve Bank but the extension of credit by banks. Every time someone borrows money, money is created. Money creation triggers for the South-African government can be defined as the following:
- Should the income from the balance of payments be greater than the payments made to foreigners, the government experiences a net inflow of foreign currency?
- Secondly when the government finances part of or its entire deficit by borrowing money from the Reserve Bank cash is in effect injected into the economy.
- Finally, Banks can sell government stock or paper issued by the state when it wishes to raise loans. Should a bank sell some of these stock (usually to the Reserve Bank) it receives cash in exchange, which can be lent out to the clients.
3.2.3 Measuring monetary policy
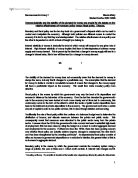
In the advanced income-expenditure framework money influences total spending only indirectly. The line of causation runs through the financial markets: a change in money supply changes interest rates, which changes investment, which is part of GDP. From this perspective it is not obvious that one should use money stock as a measure of monetary policy as an alternative possibility. Using interest rates puts one closer to the determination of GDP than does money stock. In this interpretation, higher interest rates signal a "tighter" monetary policy and lower interest rates signal an "easier" monetary policy.
The question of what is the best way to measure monetary policy has spurred considerable debate in economics. Let us begin by reviewing the arguments for using interest rates. We will explain the argument by examining what must be going on in the financial market.
The financial market can be seen in terms of a supply of and a demand for loanable funds. The exact shapes of these curves are unknown. One can argue that the supply curve is very steep because interest rates do not greatly affect savings, or one can argue that it is very flat because any one country is but a small part of the international financial market. Neither is it clear how responsive demanders are to interest rates. Nonetheless, financial markets can be represented in terms of supply and demand curves such as those in the graph below.
4. Public debt and budget deficits
- The concept of public debt and the budget deficit
Public debt can be defined as the sum of all the outstanding financial liabilities of the public sector in respect of which there is a primary legal responsibility to repay the original amount borrowed (principal) and to pay interest (debt servicing). Public debt arises primarily from the government’s annual budget deficits (Black, et al., 2003:2247). The majority of public debt is incurred through the sale of government bonds with a maturity of more than three years. As mentioned previously the difference between the government’s income and expenditure is the budget deficit or surplus. As mentioned above the deficit must be funded with borrowings. The SA budget clearly shows non-aggressive approach to a budget deficit. A larger deficit will enable the government to raise more funds for development and infrastructure. The taxpaying people will directly benefit from this. Currently the budget has a deficit of 3,1% or R49 billion. With a larger deficit say 3,5% the value of the deficit could be R55,4 billion. A 0,4% increase will result in 6,4 billion more funds to spend on job creation, development etc.
- Size and composition of the public debt
On 31 December 2001, the total debt of the South-African Government amounted to R462 billion, which was 50,7% of GDP, or roughly R10 400 per head of the population. This tells us that, if all the public debt were to be repaid immediately, the government would on average have to impose a tax of R10 400 on each citizen.
Economic growth in 2003/04 has been slower than anticipated at the time of the 2004 budget, leading to lower revenue flows than initially expected. With this in mind, state expenditure was also adjusted downwards, due to lower interest rates and lower inflation expectations. Main budget revenue is projected to be 24,6% of GDP in 2003/04 and to remain at about this level over the next three years. The table below gives consolidated view of the national budget framework.
Table 4.1 Consolidated national budget framework
The budget deficit for 2003/04 is expected to be 2,6% of GDP, up from 1,1% in 2002/03 and slightly higher than the 2,4% estimate at the time of the 2003 Budget. The revised budget framework provides for an increase in the deficit to 3,1% of GDP in 2004/05. The main budget provides for expenditure of R368,9 billion in 2004/05, rising to R439,1 billion in 2006/07. Revenue increases from R327,0 billion to R394,0 billion in the same period. The budget also has a build in contingency reserve, rising from R2,5 billion next year to R8 billion in 2006/07. This is mainly to be utilised in unforeseen expenditures like drought relief etc. South Africa’s credit rating has continued to improve over the past fiscal year, which, together with the strengthening of the currency, has resulted in the tightening of domestic spreads. The government’s net borrowing requirement is determined by the budget deficit, in addition to extraordinary receipts and payments.
5. Gross domestic product
Economic growth is measured in terms of an increase in the size of a nation’s economy. A broad measure of an economy’s size is its output. The most widely used measure of economic output is the Gross Domestic Product or GDP for short. GDP is generally defined as the market value of goods and services produced by a country. One way to calculate a nation’s GDP is to sum all expenditures in the country. This method is known as the expenditure approach and is described below.
The expenditure approach calculates GDP by summing the four possible types of expenditures as follows:
GDP = Consumption
+ Investment
+ Government Purchases
+ Net Exports
Another way of illustrating how GDP can be calculated is as follows:
Table 5.1: Calculation of GDP
GDP has risen by 12% from the first year to the second, but this increase is only partially due to additional output. Part of the increase is due to changed prices. The two values of GDP for the second year allow us to obtain a measure of inflation called the implicit price deflator or the GDP deflator. The formula for this index is: Price Index = 100 x (Nominal GDP/ Real GDP). South –Africa’s GDP grew by 8% in the previous year and its expected to grow with 9% in 2005.
Like other economic statistics, we must be aware of the limitations of the GDP statistics if we want to use them wisely. With a few exceptions, GDP only counts goods and services that pass through organised markets. Production that is not bought or sold does not generally get counted. When one looks at the per capita GDP (total GDP divided by population) of various countries, one finds some countries that have per capita GDPs of only one or two hundred dollars. This statistic may mean that the inhabitants of such countries are truly impoverished, or it may mean that most transactions are not market transactions. If a nomadic or agricultural society is self-sufficient within small groups, there may be considerable production unrecorded in the GDP statistics because none of it reaches the market.
6. Government Challenges
6.1.1 Unemployment
In the period between 1994 and 2000, significant restructuring of industrial processes led to increased productivity accompanied by declines in formal employment in older industries. This, combined with growth in the economically active population, has contributed to increasing unemployment figures. Shifts in labour demand toward higher skilled employees and falling labour intensity of production have affected the labour market. There is now evidence of formal job creation once more in the older sectors. The survey of Employment and Earnings indicated an expansion in employment in the formal economy of 5% between September 2001 and September 2002. Skills enhancement is a central pillar of the Governments efforts to reduce unemployment. The skills development levy will contribute R3,6 billion to skills development to reduce the current unemployment rate of 40%. Government policy is aimed at steering the economy from a slow growing and non-job creation towards a dynamic, fast growing; job creating and development oriented economy. To achieve these ends the government needs to strive to reach equilibrium between compatibility of skills supplied and demanded. Our education system must be skills focused. The Budget is limited in its disclosure of the level of unemployment. To give a clearer picture it should analyze by breaking down these statistics into demographics, racial and age groups.
6.1.2 Development and poverty upliftment
Many achievements and strengths to build on can be identified but the main challenge ahead is to overcome the divisions between the “two economies”. On the one hand South Africa has a 1st world economy with state of the art services. The challenge is to bring the 3rd world economy with characteristics of under development and poor services closer to each other. First among the aims of the RDP was to meet the basic needs of all South Africans. Successive budgets have progressively extended the resource envelope devoted to services in poor communities. The 2004 budget has provided for progressive meeting of social and economic rights. Some examples of achievements in the past 10 years include the following:
- 1,6 million new houses was build
- 700 new primary health clinics have been constructed, 212 upgraded and 21 mobile clinics established
- Portable water supply have been extended to 9 million people
- Rapid growth of mobile telephony has raised the proportion of households with telephones from 29% in 1996 to 42% in 2001. Telkom has invested in over 150 000 new public phones and connections to schools, police stations, clinics and hospitals.
- Almost 3 billion hectares of land has been redistributed, benefiting 700 000 households.
- About 4,5 million children benefit from the primary school nutrition program.
Available from:
6.1.3 HIV/AIDS
According to Clem Sunter, companies do not see HIV/AIDS as being a strategic issue, and will only react once the effect is felt on the bottom line. Some 20% of South Africa’s adult population is HIV positive. A total of 400 000 people died of aids in 2002 and by 2005 six million people are expected to be infected. Government is criticised by business for not doing enough to fight the pandemic. However this budget provides only R2.1 billion more than the previous year for HIV and Aids treatment plans. This is still not enough but a step in the right direction.
In South Africa it is only the bigger companies that can afford to provide medicine for infected employees because by not doing so it affects their bottom lines. It cost a company between R8000 and R10 000 a year to provide one employee with HIV medicine. Available from:<http://www.bday.co.za > [accessed on 30 May 2004] Research indicates that in future the gross domestic product will be lower than it would have been without Aids, because the resources of government and families would be channelled to treat more people infected with HIV/Aids. Thus instead of money being saved or invested, it must be used for those with HIV/Aids. The real impact is that a large portion of the skilled workforce will be totally wiped out. Employment structures will be weakened and the loss of skills to the economy will be significant.
7. Conclusion
In a dramatic turn of events, South Africa saw a transition of power from centuries of minority rule to a democratically elected majority rule. International history indicates that a period of transfer of power, especially as dramatic as South Africa’s, goes hand in hand with political unrest, economic bereavement and a collapse of social infrastructure. This was, however, not the case. Although changes introduced by the government were drastic in nature, a conservative approach was implemented after consultation with affected parties. This resulted in an economic climate that was conducive to growth, and although international investors were sceptical at first, foreign direct investment increased year on year.
Using sound economic principles and maintaining a balance between income, expenditure and repayment of government debt puts South Africa firmly in 1st position on the continent. South Africa’s natural resources, in particular platinum group metals and gold, are well sought after by international industries (South Africa provides for over 80% of international platinum demand). Nostradamus made the comment centuries earlier that said, “Whoever controls the southern tip of Africa controls the world”.
The challenge for the South African government lies in attracting high levels of foreign direct investment. To be able to manage this, the cost of labour needs to remain competitive, a healthy workforce needs to be maintained (with specific regard to potentially crippling effects that HIV/AIDS could have), white and blue-collar crime need to be well policed. A prime objective of the government is to address the low levels of employment – a situation that will resolve itself only if foreign direct investment increases dramatically and government expenditure increases on public works programmes. South Africa’s approach to invest heavily in education, health and welfare provides a long-term solution for sustainable growth and development.
To review, the 2004 budget provide for acceleration of public spending on services in the years ahead, and several further shifts in priority. The 2004 budget draws strongly on the priorities and programs of earlier budgets, emphasising the consolidation and reinforcement of the reconstruction and development initiatives that are under way. As already mentioned the policy priorities for the decade ahead are:
- Increasing infrastructure and industrial investment, promotion of PPP’s.
- Improving education, training and skills development.
- Extending social security, income support and work opportunities.
- Improved regulation of markets and public entities, more efficient public services.
Although the budget speech itself was rather thin on detail, the emphasis that the minister placed on microeconomic reforms is welcomed. The budget provides sufficient allocation of funds to the prioritised areas.
- Bibliography
-
BLACK, P.A., CALITZ, E. & STEENEKAMP, T.J. 2003. Public economics for South African students. 2nd ed. South Africa: Oxford. 341 p.
-
CASE, K.E. & FAIR, R.C. 2003. Principles of economics. 6th Ed. Upper Saddle River, NJ : Prentice Hall. 743 p.
-
ROUX, A. 2002. Everyone’s guide to the South African economy. 7th Ed. Oxford: Zebra Press. 180 p.
- Web [www.absa.co.za]
- Web [www.resbank.co.za]
- Web [www.sbic.co.za]
- Web [www.bday.co.za]