The variables in the data set are:
Price House price in £000
Bedrooms Number of bedrooms
Size Size of property in square feet
Distance Distance from nearest large town
Town Which of the 5 towns the property is in
Garage Whether property has garage (0 = no, 1 = yes)
Baths Number of bathrooms (lavatory and washbasin = 0.5)
Note: In the following report, the value of price is in £000. And relating to whether the house has a garage, '0' represents 'no' and '1' represents 'yes'.
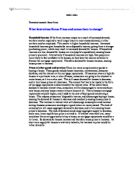
Look at the overall distribution of house prices in the survey.
Descriptive Statistics: Price
Variable N Mean Median TrMean StDev SE Mean
Price 105 221.10 213.60 220.00 47.11 4.60
Variable Minimum Maximum Q1 Q3
Price 125.00 345.30 186.85 251.85
The graph shows a positive skew. As price increases, the number of houses within that price starts low then rises steeply around 170. It then steadily goes back down. The distribution of house prices has a large spread varying from 125 (min) to 345.3 (max), but the majority lies in between. The modal group being 170-190. The lower quartile is 186.85, and the upper quartile is 251.85. The mean 221.1 and median 213.6.
What is the proportion of houses with garages?
Tally for Discrete Variables: Garage
Garage Count
0 34
1 71
N= 105
71 houses out of the 105 have garages. This is 67.6%.
Is the proportion with garages the same in all 5 towns?
Proportion with garages in each town
Town 1 9/15 = 0.6
Town 2 15/20 = 0.75
Town 3 15/25 = 0.6
Town 4 20/29 = 0.69
Town 5 12/16 = 0.75
The proportion with garages is not the same in all 5 towns. However the proportion in Town 1 and 3 is the same (60%). Town 2 also has the same proportion as Town 5 (75%). And Town 4 has 69%.
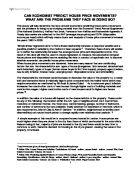
Examine whether the distribution of house prices varies by whether the house has a garage.
Descriptive Statistics: Price by Garage
Variable Garage N Mean Median TrMean StDev
Price 0 34 185.45 186.85 186.17 28.00
1 71 238.18 236.40 236.72 44.88
Variable Garage SE Mean Minimum Maximum Q1 Q3
Price 0 4.80 125.00 242.10 170.33 207.50
1 5.33 166.20 345.30 198.90 269.90
The price of houses with garages (1) is higher than houses without a garage (0). You can see this from the graph and the statistics. 0 varies from 125 to 242.10. 1 is higher, varying from 166.2 to 345.3. The mean of 0 is 185.45, and the mean of 1 higher at 238.18. The median of 0 is 186.5, and the median of 1 higher at 236.4. The Q1 and Q2 of 1 is also higher (198.9, 269.9) than Q1 and Q3 of 0 (170.33, 207.5).
Examine the relationship of house price to size of house.
Correlations: Price, Size
Pearson correlation of Price and Size = 0.371
P-Value = 0.000
There is a weak positive relationship between the house price to size of house.
As size increases, price increases.
Investigate ONE other variable (e.g. Number of bedrooms or bathrooms or distance from nearest town) that may be related to the house price.
Correlations: Price, Distance
Pearson correlation of Price and Distance = -0.347
P-Value = 0.000
There is a weak negative relationship between the price and distance from nearest large town. As distance decreases, price increases.
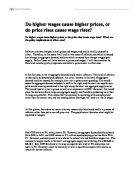
Find some recent data on house prices in the UK for different regions, and present the data using a suitable table and diagram and comment.
House prices are much higher in England than in Wales. Figures are given on the graph.
Houses are most expensive in London, averaging at 201, 913. Followed by South East (160,424), East (129,630), South West (123,740), West Midlands (97,542), East Midlands (87,711), North West (77,738), and Yorkshire and the Humber (75,711). Finally, the lowest house prices are in the North East (67,915).