Industry and Competition
Rigid disk drive industry is intensely competitive. The important competitive factors are as follows: Product Quality, Reliability, Form factor (size of disk), price per unit, price per megabyte, production volume capability and responsiveness to customers.
The important competitors of Seagate include Quantum, Western Digital, IBM, Toshiba, NEC and Fujitsu.
Another challenge in rigid disk drive industry is the rapid drop in prices of hard drives. The depreciation stands at 40% per year from 1980-1995. Hence one model of hard drive sells only for 4-6 quarters.
Manufacturing Strategy and Process
The manufacturing process of a rigid disk drive involves following steps:
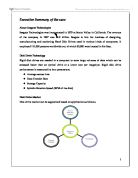
Fig 2: Manufacturing Process of Rigid disk drive at Seagate
The final assembly plants are located in: Singapore, Thailand, Malaysia, China, Ireland, Minnesota and Oklahoma. The sub-assembly plants are located in Singapore, Malaysia, Thailand, Minnesota, California, Northern Ireland, Indonesia, Mexico, China and Scotland.
Manufacturing strategy of Seagate was based on following aspects.
- High volume manufacturing
- Low-cost assembly and test
- Vertical integration
- Maintenance of key vendor relationships
Capital Investment and Sales-plan Driven Planning
Seagate wishes to conduct an exercise called Capacity Resource Planning (CRP) for its two new models namely Barracuda and Cheetah. Capital investments are a result of CRP. CRP intermeshes with the production planning process. In the sales-plan driven planning, Seagate consolidates demand forecasts of monthly worldwide demand for each individual product. This forecast captures the demand uncertainty by a probability distribution over likely demand scenarios.
In the current problem, the Total Demand for two new products forecasted is 600,000 units. The two products are substitutes of each other hence error estimate is about 100,000 units. There are three scenarios possible
The task at hand is to identify capacity configuration for Cheetah and Barracuda. We also have to find out expected profit and ROI under this investment. We have adopted Linear Programming solution approach to the problem.
Linear Programming Solution
Here we maximize the expected profit with the capacities of Barracuda (B) assembly, Cheetah (C) assembly & testing facility as the variables.
Objective function
Maximize
Profit=
25%* (Min (pessimistic demand of B, assembly capacity of B)*300 + Min (pessimistic demand of C, assembly capacity of C)*400)
+ 50 %*( Min (expected demand of B, assembly capacity of B)*300 + Min (expected demand of C, assembly capacity of C)*400)
+ 25 %*( Min (optimistic demand of B, assembly capacity of B)*300 + Min (optimistic demand of C, assembly capacity of C)*400)
of 20* (assembly capacity of B) – 30*(assembly capacity of C) – 80*(testing capacity) - 40
[Unit in the above equation is thousand dollars]
Constraint(s)
Assembly capacity of B <= 350
Assembly capacity of C <= 450
Testing capacity <= Assembly capacity of B + Assembly capacity of C
Solving the above Linear Programming; we get the following solution:
So, Investment required=
$ 40 million fixed cost + 350* $ 20,000 + 450* $ 30,000 + 600* $ 80,000
= $ 108.5 million
Explanation
In the objective function, for each case we take the minimum of demand & capacity – i.e. if demand is less than capacity, then only the demand amount is sold; if demand is more than capacity, till we are able to sell up to the capacity.
In the solution obtained, it is observed that the sum of the two assembly capacities is greater than the testing facility capacity. This is because the demands of Barracuda & Cheetah have a negative correlation. So when the demand of Barracuda would be maximum, the demand of Cheetah would be less. So it makes sense to have testing capacity lower than the total of both assembly capacities. This indicates that the demands of the two products are acting as hedge against demand uncertainty.
We calculated Profit in case of current plan and suggested plan and compare which is better. This is presented in tabular form below.
Alternate Approach to solve the problem (Newsboy Model)
The capacity decision to be taken in this case is assembly capacities (Say A1, A2) and combined testing capacity, T; where 1 and 2 denotes Barracuda and Cheetah respectively. Now, the company will face actual demand D1 and D2. The variable contribution margin for Barracuda (1) is $300,000 and for Cheetah (2) is $400,000 per thousand units.
Production decision:
Produce D2 subject to capacity constraint A2 and T (say Q1)
Thereafter, produce D1 subject to capacity constraint A1 and (T-Q1), say (Q2).
Assembly capacity A1:
Cost of under capacity: Cu= 300,000 per thousand unit (the entire variable contribution margin is lost)
Cost of over capacity: Co=20,000 per thousand unit (the capacity goes waste)
Mean demand, µ= 300
Standard deviation, σ=35.36 (from the given probability distribution)
Using the formula for unknown distribution but given µ and σ
Q1*approx = 363.9 thousand units
Taking the minimum incremental capacity to be 50,000 units, Q1*= 350 thousand units
Assembly capacity A2:
Cost of under capacity: Cu= 400,000 per thousand unit (the entire variable contribution margin is lost)
Cost of over capacity: Co=30,000 per thousand unit (the capacity goes waste)
Mean demand, µ= 300
Standard deviation, σ=109.09 (from the given probability distribution)
Using the formula for unknown distribution but given µ and σ
Q2*approx = 479.13 thousand units
Taking the minimum incremental capacity to be 50,000 units, Q1*= 450 thousand units
Testing capacity T:
Cost of under capacity: Cu= 300,000 per thousand unit (the lower variable contribution margin will be lost first as the priority is given to the higher margin product in the testing)
Cost of over capacity: Co=80,000 per thousand unit (the capacity goes waste)
Mean demand, µ= 600
Standard deviation, σ=70.71 (from the given probability distribution)
Using the formula for unknown distribution but given µ and σ
Q*approx = 650.21 thousand units
Taking the minimum incremental capacity to be 50,000 units, Q*= 650 thousand units
Hence solution set:
So, Investment required=
$ 40 million fixed cost + 350* $ 20,000 + 450* $ 30,000 + 650* $ 80,000
= $ 112.5 million
We calculated Profit in case of current plan and suggested plan and compare which is better. This is presented in tabular form below
Annexure
Sample calculation of Profit as per current and suggested plan for Linear Programming model;
Similar Calculations were done for Newsboy model approach
Pessimistic demand:
Present plan: Profit = 300 thousand* $300 + 150 thousand * $400 - $ 103 million = $ 47 million
Suggested plan: Profit = 350 thousand* $300 + 150 thousand * $400 - $ 108.5 million = $ 56.5 million
Expected demand:
Present plan: Profit = 300 thousand * $300 + 300 thousand * $400 - $ 103 million = $ 107 million
Suggested plan: Profit = 300 thousand* $300 + 300 thousand * $400 - $ 108.5 million = $ 101.5 million
Optimistic demand:
Present plan: Profit = 250 thousand * $300 + 300 thousand * $400 - $ 103 million = $ 92 million
Suggested plan: Profit = 300 thousand* $300 + 450 thousand * $400 - $ 108.5 million = $ 161.5 million