
The Mandelbrot set is a set of points in a complex plane, c, of the orbit, which is how the function operates under the iteration of zn+1 = zn2 + c around 0.
Mandelbrot Set The Mandelbrot set is a set of points in a complex plane, 'c', of the orbit, which is how the function operates under the iteration of zn+1 = zn2 + c around 0. A value of 'c' is included the Mandelbrot set if the orbit of 0 undergoing the iteration of zn+1 = zn2 + c, and the value s does not tend to infinity. In other words if the orbit of 0 tends to infinity, then that the 'c' value is not in the set. To see this properly let 'c' be any complex number and then let zn be 0 in the iteration of zn+1 = zn2 + c, you will notice that you will get c back from the resulting answer; 02 + c. This can repeated by letting c be x for the next iteration in the original equation, and this will yield c2 + c. You can continue repeating putting the previous answer in for x into the equation and the result will be (c2 + c) 2 + c. Doing this continuously will create a list of complex numbers and if these complex numbers are increasing in size and thus further away from the origin then 'c' is not in the Mandelbrot Set. If however the opposite occurred and it not move away from the Mandelbrot set and did not increase in size then it is considered to be inside of the Mandelbrot Set. Some examples of numbers in the Mandelbrot Set are: 0, -1, i, and -2. Below is an example of four iterations of the c value -1. As you can see these examples fluctuates from 0 to -1 and it will
Bridges of Knigsberg & Eulerian circuits
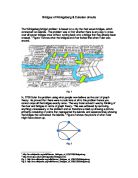
Bridges of Königsberg & Eulerian circuits The 'Königsberg bridge' problem is based on a city that had seven bridges, which connected two islands. The problem was to find whether there is any way to cross over all seven bridges once without turning back onto a bridge that has already been crossed.1 Figure 1 shows what the bridges and river looked like when Eular was around. Fig. 1 In, 1736 Euler the problem using what people now believe as the start of graph theory. He proved that there were no solutions at all to this problem hence you cannot cross all the bridges exactly once. The way Euler solved it was by thinking of the river and bridges in terms of graph theory. This was achieved by removing anything unnecessary to the problem and so therefore ended up drawing a picture primarily consisting of points that represented the islands and separate lines showing the bridges that connected the islands.2 Figure 2 shows the picture of what Eular might have drawn up. Fig. 2 As you can see the problem now looks much simpler and one could attempt to solve by just using a pencil and going around the lines looking for a solution but to find a systematic approach to is incredibly tedious laborious. Euler devised a new notion; degree of nodes.3 The Degree of Node is the number of connections or edges the node has to other nodes.4 Euler said that any graph can be fully crossed with

This paper presents a model of a four-cylinder spark ignition engine, which shows the capability of Simulink to model an S.I. engine from the crankshaft output down to the throttle.
Introduction This paper presents a model of a four-cylinder spark ignition engine, which shows the capability of Simulink to model an S.I. engine from the crankshaft output down to the throttle. Back ground The basic model accommodates the capabilities of Simulink 2 to ascertain the time- based events with high accuracy. In the simulation, the subsystem models transfer fuel and air mixture from the intake manifold to the cylinders via the valves. This occurs concurrently with the time processes of the intake flow, torque generation and acceleration. A second model subsystem is triggered which provides the closed-loop engine speed control via the throttle actuator. These models can be applied as stand-alone engine systems. Model description The model is based on the published results by Crossley and Cook (1991), which describes a simulation of a four-cylinder spark ignition internal combustion engine. The Crossley and Cook work shows how the simulation model was validated against a dynamometer test. The list below analyse the key elements of an engine model as defined by Crossley and Cook: * Throttle * Intake manifold * Mass flow rate * Compression stroke * Torque generation and acceleration Additional components can be added to the model to gain greater accuracy in the simulation. Throttle The simulation on the throttle body is based on the control input
The purpose of this coursework is to find the different between the products of the number in the opposite corners of each rectangle in the grid.
Introduction The purpose of this coursework is to find the different between the products of the number in the opposite corners of each rectangle in the grid. I need to explain any patterns that I find, and then arrive at a formula for each pattern * As you see the box is drawn round six numbers in a 2 * 3 rectangle * Find the product of the top left number and the bottom right number in this box * Do the same with the top right and bottom left numbers * Subtract the sum of them * What remaining is the difference The difference numbers of 2 * 3 45 46 47 55 56 57 45 * 57 = 2565 55 * 47 = 2585 This is first technique to find out the difference of the 2565 - 2585 = 20 The difference numbers of 2*4 41 42 43 44 51 52 53 54 51 * 44 = 2244 41 * 54 = 2214 2244 - 2214 = 30 The difference number of 2*5 71 72 73 74 75 81 82 83 84 85 71 * 85 = 6035 81 * 75 = 6075 6035 - 6075 = 40 The difference number of 2*6 75 76 77 78 79 80 85 86 87 88 89 90 75 * 90 = 6750 85 * 80 = 6800 6750 - 6800 = 50 Results: 2* 3 = 20 2*4 = 30 2*5 = 40 2*6 = 50 0n - 10 0 ( n - 1 ) Tes my formula for 2 * 7 (n = 7 ) When width = 3: The difference number of 3 * 3 5 6 7 5 6 7 25 26 27 5* 27 = 135 25 * 7 = 175 35 - 175 = 40 The difference number of 3*4 61 62 63 64 71 72 73 74 81 82 83 84 61 * 84 = 5124 81 * 64 = 5184

Using the Difference Method to Find an Equation to Establish the Number of Squares in a 3D Version of the Pattern
Using the Difference Method to Find an Equation to Establish the Number of Squares in a 3D Version of the Pattern Pos.in seq. 0 1 2 3 4 5 No.of squar. -1 1 7 25 63 129 st differ. 2 6 18 38 66 2nd differ. 4 12 20 28 36 3rd differ. 8 8 8 8 So therefore we get the equation; anƒ + bn2 + cn + d We already know the values of 'n' (position in sequence) in the equation so now we have to find out the values of a, b, c, and d. If n = 0 then d = -1 and if n = 1 then d = 1 I can now get rid of d from the equation to make it easier to find the rest of the values. I will will take n = 2 to do this in the following way: st calculation _ 8a + 4b + 2c + d a + b + c +d 7a + 3b + c D will always be added to each side of the equation. 2nd 8a + 4b + 2c = 8 = 4a + 2b + c = 4 2 So then n = 2 8a + 4b + 2c = 8 = 4a + 2b + c = 4 n = 3 27a + 9b + 3c = 26 n = 4 64a + 16b +4c = 64 = 16a + 4b + c = 16 4 To get rid of 'c' I will use this calculation; _16a + 4b + c = 16 4a + 2b + c = 4 2a + 2b = 12 We can simplify this equation to: 6a + b = 6 My next calculation is below: N =3 _27a + 9b + 3c = 26 2a + 6b + 3c = 12 15a + 3b =14 (15a + 3b = 14) ÷ 3 = 5a + b = 4Y If I use the equation above 6a + b = 6. I can take my latest equation and subtract it from it to find 'a'. So, _6a + b = 6 5a + b = 4Y a = 15 Now that we nave obtained 'a' we can now

What is Mathematics?
What is Mathematics By Clement Ng What is mathematics? If you ask this question of the first person you meet on the street you will most likely hear that "Mathematics is the study of number." If you insist that your respondent be more specific, you may elicit the suggestion that mathematics is "The Science of number." But that is about as far as you will get, and it is not an adequate description of mathematics. It is out of date by 2500 years! The answer to the question "What is Mathematics?" has changed several since then. Until around 500 BC, mathematics was indeed about numbers. Ancient Egyptian, Babylonian, and Chinese mathematics consisted almost solely of arithmetic. It was largely utilitarian and very much of a "cookbook" variety. ("Do such and such to a number and you will get the answer.") Between 500BC and AD300, Mathematics expanded beyond the study of number. The mathematicians of ancient Greece were concerned more with geometry. Indeed, they regarded numbers in a geometric fashion, as measurements of length, and when they discovered that there were lengths to which their numbers did not correspond (called irrational lengths), their study of number largely came to halt. For the Greeks, with their emphasis on geometry, mathematics was about number and shape. Only with Greeks did mathematics change from a collection of techniques for measuring, counting, and
Forces on various bodies in an airstream
Experiment F1 FORCES ON VARIOUS BODIES IN AN AIRSTREAM - INTRODUCTION The report details the theory and experimental method of how to determine the forces on different bodies within an air stream. The theory involves the drag and lift coefficients. The first experiment will measure the drag force on a sphere and how it varies. This is then repeated for different axisymmetric bodies. The last experiment will measure how the lift and drag forces on an aerofoil vary with angle of incidence. .1 Purpose of Experiment - To observe quantitatively how the drag force varies on a sphere with the velocity of the airstream. - To measure the drag forces of various axisymmetric bodies (all with the same circular maximum cross section and axis of symmetry aligned in the flow direction) and to observe how the forebody and afterbody shape affect the drag. - To observe how lift and drag forces on an aerofoil vary with angle to the airstream. - Explain the nature of force variation and local flow direction at various points around a body using a wool-tuft for investigation. .2 Background and Theory Relative motion between a body and a fluid (when a body moves through a fluid at rest or when a fluid flows over a body) causes a force on the body. The horizontal component of this force is the drag and the vertical component is the lift. The magnitude of these forces depends on
This experiment is to measure and calculate the partial molar volumes of sodium chloride solutions as a function of concentration from densities measured with a pycnometer, as well as to calculate three types of density measurements of CaCO3, a powder.
Introduction The purpose of this experiment is to measure and calculate the partial molar volumes of sodium chloride solutions as a function of concentration from densities measured with a pycnometer, as well as to calculate three types of density measurements of CaCO3, a powder. The partial molar volume is defined as, the increase in the volume of an infinite amount of solution (or any amount so large that insignificant concentration change will result.), when one mole of component i is added. The partial molar volume is not necessarily equal to the volume of one mole of pure i. This quantity is of interest because of its thermodynamic relationships with other partial molar quantities such as chemical potential (Gibbs free energy). The deviations from values expected for ideal solutions of partial molar volumes are also of interest in connection with the theory of solutions especially as applied to binary mixtures of liquid components. The volume of the pycnometer is determined using the equation: V= Wo-We do (Equation 1) in which Wo is the weight of the pycnometer filled with deionized water, We is the weight of the dry pycnometer, and do is the density of pure water at 25 degrees Celsius. The calculation of the density of the solution is found by: D= Wsolution V (Equation 2) The calculation for the molality of the solution is found by: m=
Development of Calculus
Mas3039 Mathematics: History and Culture Topic 3: The Development of Calculus Essay (2): Compare Newton and Leibniz' work on calculus, and contrast their approaches to the fundamental theorem of calculus. Discuss at least one example of a previously unsolved problem that was solved using calculus by Newton or Leibniz. The development of infinitesimal calculus followed a long and uneven path stretching from the philosophical speculations of the early Greeks and the classical proofs of Archimedes to the 17th century when significant changes occurred both in the quantity of work done and in the nature of the methods used.1 Mathematicians Newton and Leibniz have been accorded a central role in the 'invention' of the calculus. Although the calculus neither started, nor finished, with these two men, they are considered the inventors because they each developed general concepts that were different in style, in Newton's case, the fluxion and fluent, and for Leibniz, the differential and integral. Newton and Leibniz developed notations and algorithms, which allowed the easy use of these concepts.2 They never met and drew separately from the work on calculus achieved by mathematicians Cavalieri, Descartes, Fermat, Wallis and others. Newton and Leibniz clearly owed much to their immediate predecessors, but their mutual influence during the crucial periods when they were making their
Maths Economics
Mathematical Economics /9/2012 . IS/LM Model: The IS/LM model (Investment Saving/Liquidity preference Money supply) is a macroeconomic tool that demonstrates the relationship between interest rates and real output in the goods and services market and the money market. The intersection of the IS and LM curves is the "General Equilibrium" where there is simultaneous equilibrium in both markets. File:Islm.svg The model is presented as a graph of two intersecting lines in the first quadrant. The horizontal axis represents national income or real gross domestic product and is labelled Y. The vertical axis represents the real interest rate, i. Since this is a non-dynamic model, there is a fixed relationship between the nominal interest rate and the real interest rate (the former equals the latter plus the expected inflation rate which is exogenous in the short run); therefore variables such as money demand which actually depend on the nominal interest rate can equivalently be expressed as depending on the real interest rate. The point where these schedules intersect represents a short-run equilibrium in the real and monetary sectors (though not necessarily in other sectors, such as labour markets): both the product market and the money market are in equilibrium. This equilibrium yields a unique combination of the interest rate and real GDP. IS curve For the IS curve, the