Ripping the Bodice - Romance Novels and Perceptions of Rape in America
Ripping the Bodice: Romance Novels and Perceptions of Rape in America Introduction: In the United States [TJL1]today, life is shaped by popular culture. Television presents a picture of what society [TJL2] should look like. The radio tells society what it should think and listen too.[TJL3] The Internet influences the opinions people make and how they learn about current events. Popular culture forms how society acts, what it wears, how is eats, and so much more. The extent of the power of popular culture is incredible, entering into every area of life. It therefore becomes important to study the effects that popular culture can have on American society, what those effects are, and how to address and stop those effects. Romance novels[TJL4] are one of the best-selling genres in the publishing world. This genre is a multi-million dollar a year industry, and it is mainly geared towards women. With such a large following, one must wonder what message romance novels are sending out to their readers. What are these novels saying about romance, about love? What are these romances saying about sex? Sex is one of the first features one thinks of when one thinks about romance novels. Romance novels typically include multiple sex scenes between the hero and heroine. It would be understandable then, to assume that women's perceptions of sex might be influenced by what

After careful consideration over the possible investigations that can be carried out with the data at hand, I have made a decision on the investigation that I am going to carry out.
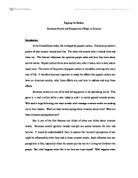
Statistics Coursework AIM: After careful consideration over the possible investigations that can be carried out with the data at hand, I have made a decision on the investigation that I am going to carry out. I want to investigate the times in ten minute periods at which goals are scored; this will be done for all four of the league results that I have. I want to do this investigation so that I can find out in what ten minutes of the game, the most goals are scored. METHOD: The way in which I can obtain the data that I want to analyse, has to be unbiased. The reason is so that the investigation becomes fair and as correct as it can possibly be. I already have me resource for data, this resource contains the football results from four of England's largest football leagues and contains the results of them for six consecutive weeks. I am going to use this resource to carry out my investigation; these results are totally factual and have no biased approach to my investigation whatsoever. From observation of the resource that I have, I see that the Premiership league has less games played on a weekly basis than the other leagues do, this is due to less teams being in the Premiership than in the other leagues and divisions. Due to this, I will have to pick as many teams as possible per week from the Premiership for analysis, and then use that same number to pick from

The objective of this project is to investigate whether prices in stock markets follow a weak form efficient process.
TABLE OF CONTENTS INTRODUCTION 2 2 DATA AND METHODOLOGY 2 2.1 JARQUE-BERA STATISTICS FOR NORMALITY 4 2.2 LJUNG-BOX STATISTICS FOR SERIAL CORRELATION 5 2.3 AUGMENTED DICKEY-FULLER TEST OF UNIT ROOT 5 2.4 RUNS TEST FOR RANDOMNESS 6 3 RESULTS AND DATA ANALYSIS 7 3.1 DESCRIPTIVE STATISTICS 7 3.2 RESULTS FROM JARQUE-BERA NORMALITY TEST 10 3.3 RESULTS FROM LJUNG-BOX STATISTICS FOR SERIAL CORRELATION 11 3.4 RESULTS OF ADF TEST FOR UNIT ROOT 14 3.5 RESULTS OF RUNS TEST FOR RANDOM WALKS 16 4 CONCLUSION 18 Introduction The concept of 'efficient' stock market has been hotly debated ever since Eugene Fama first introduced it around some thirty years ago. Under the weak form of market efficiency, the price of a security reflects all the available information about the economy, the market and the specific security, and that prices adjust immediately to new information. For a long time the conformation of random walk is considered to be a sufficient condition for market efficiency. However, rejection of random walk model does not necessarily imply the inefficiency of stock-price formation. Random walk is the path of a variable over time that exhibits no predictable patterns at all. If a price, p, moves in a random walk, the value of p in any period will be equal to the value of p in the period before, plus or minus some random variable. The random walk hypothesis states that

Dress code study. The method of random sampling in this investigation was cluster sampling. The population of our investigation was all ABC University female students. Since all ABC University female students stay in block 1, we took 20 students from thr
TABLE OF CONTENTS CONTENT PAGE Introduction 2 Investigation 1: Number of summons received by female student of ABC University The Centre of a Distribution 5 The Variability (Spread) of a Distribution 7 Conclusion 11 Investigation 2: Restrictions that female ABC University students wish to abolish 12 Restriction 1: Short Shirt (does not cover bottom) 13 Restriction 2: Sleeves of shirt do not reach wrists 20 Restriction 3: Too tight pants 27 Restriction 4: Pants shorter than ankle length 34 Investigation 3: Number of restrictions that ABC University female students wish to abolish The Centre of a Distribution 42 The Variability (Spread) of a Distribution 45 Conclusion 47 Overall Conclusion 48 Introduction Certain attire restrictions are imposed on students of ABC University. Students who fail to abide the regulations will receive summonses from the security guards at ABC UNIVERSITY. Some students complain about the restrictions as they claim that the restrictions imposed are not reasonable. On the contrary, the authorities insist on upholding the rules as they intend to promote professionalism among the students. Therefore, it is the intention of our group to find out the number

To establish how religious/community background, income, age and education have effect on the attitudes towards the Good Friday Agreement
Background Overall research aim To establish how religious/community background, income, age and education have effect on the attitudes towards the Good Friday Agreement. .3 Specific Objectives Using data from the 2001 Northern Ireland Life and Times Survey, we will * To establish if there is a demand among the target market for a change in the menu. * To establish the prices that the target market are willing to pay for particular options/foods on the menu. * To establish when students are more likely to eat e.g. times, lunch, evening etc. * To identify the choices that the target market want included on the new menu. .4 Research approach For such research to take place, it is important that sufficient data is collected to establish an overall result. Accurate data will enable these results to be analysed, and improvements for the client can be discussed effectively. .41 Secondary Data Secondary data is necessary in market research, and takes place before the collection of the primary data. The purpose for this type of research is that it avoids repeating work, which may have been carried out by others, and assesses the availability of information so that the assumptions for primary research can be established. Secondary research often reduces the amount of field research and cost. Secondary data research involves: ) Examining internal organisational

RESEARCH PROPOSAL In order to identity the specific fields within the broad genre of socio-economic trends that affect the percentage of women in parliament, it is necessary to review current theoretical research and information. It is clear from prelimin
RESEARCH PROPOSAL I will adopt a linear model for this research design. It will take the form of a progression of linear steps that are simple to follow. The first of these steps is to define the theory I will be investigating and develop my hypothesis. Introduction The exclusion of women from politics, in particular political office, can be charted back to as early as 350BC when Aristotle, in his 'Politics' treatise, classed women, children and slaves as external to his definition of a citizen. Despite the legacy of the suffragette movement of the early 20th century, and the contemporary claims of sexual equality, politics remains, essentially, a political domain. From initial observations of party lists and parliamentary data from the Inter-Parliamentary Union, it transpired that, despite obviously making up 50% of any population, women's actual representation in parliaments fell to as low as 5% (Appendix 1). Although there are clearly some ideological explanations for this, such as a society's attitude to women, or more practical reasons, for example the candidate nomination process of a party, I was interested in ascertaining whether any more widespread conclusions could be made if the social and economic status of the country and of the women in that country were investigated. It was possible to observe from the preliminary findings that the Nordic countries (Sweden,
Does the data indicate that the revised (one week) forecast is significantly more accurate than the first (one month) forecast? In order to find out whether the revised forecast is significantly more accurate than the first forecast, we can use t-test to
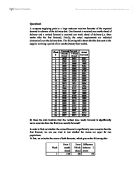
Question1 A company supplying parts to a large customer receives forecasts of the expected demand in advance of the delivery date. One forecast is received one month ahead of delivery and a revised forecast is received one week ahead of delivery (i.e. three weeks after the first forecast). Finally, the actual requirements are indicated electronically on the delivery date. The following table shows that the data sent to the supplier covering a period of six months (twenty four weeks). (i) Does the data indicate that the revised (one week) forecast is significantly more accurate than the first (one month) forecast? In order to find out whether the revised forecast is significantly more accurate than the first forecast, we can use t-test to test whether the means are equal for two populations. At first, we calculate the errors of both forecasts, which give us the following data: Week Error 1 month ahead Error 1Week ahead Difference between 2 errors -129 -80 49 2 -508 -468 40 3 -1050 -989 61 4 -476 -366 10 5 -1800 -1615 85 6 -1041 -956 85 7 -949 -979 -30 8 -515 -630 -115 9 -1188 -1243 -55 0 -1068 -34 034 1 -621 23 744 2 -579 -178 401 3 -956 258 214 4 -890 -819 71 5 27 53 26 6 48 08 60 7 -780 -750 30 8 -1089 -1012 77 9 -1072 -1173 -101 20 -1758 -1769 -11 21 -1032 -984 48 22 -1444 -1229

A Critical Appraisal of Three Research Studies Related To Peripheral Venous Cannulae and the Incidence of Phlebitis.
A CRITICAL APPRAISAL OF THREE RESEARCH STUDIES RELATED TO PERIPHERAL VENOUS CANNULAE AND THE INCIDENCE OF PHLEBITIS. INTRODUCTION It is widely acknowledged that intravenous therapy is an integral part of total patient care of many hospital patients. (Goodinson 1990, Stonehouse 1996, Parker 1999). A variety of devices are used to deliver intravenous fluids, medication, total patient nutrition and blood products. The most common delivery method being by the percutaneous insertion of a peripheral venous cannula. According to Campbell (1998) twenty five million NHS patients per year are estimated to receive some form of intravenous therapy via a peripheral route. Peripheral venous cannulation has been associated with sepsis that causes substantial morbidity in patients, prolonged hospitalisation and increased hospital costs. (Maki 1991 cited in Campbell 1998 p1308, Pearson 1996 cited in Scales 1997 pS4, Curran et al 1998). Three main theories appear to provide a basis for predicting the occurrence of phlebitis. Physical theories support the premise that veins are traumatised by physical contact with organic or inorganic materials, The principle of the septic theory suggests that phlebitis develops as a direct result of sepsis or infection. Whilst Chemical theories propose that phlebitis is caused by the irritation of the vein wall by infusion fluids. (Campbell 1998). However,

Looking at the similarities and differences between jobs and pay that effect the young and old, and between men and women.
Main Introduction In this piece of coursework, I will be looking at the similarities and differences between jobs and pay that effect the young and old, and between men and women. I will also be looking at other aspects which could affect people's Work and Pay, or might be caused by it. To do this, I will be looking at both Primary and Secondary information, separately and together, to make as complete a comparison between them as I possibly can. I obtained the information for my Secondary data from within "Fact File 1998", which gave me the opportunity to choose several different types of data for comparison. This is a publication produced every year by the Government. It provides statistical data on a wide range of categories, including jobs and pay, by gender and age. It also includes data on car and house ownership, holidays and a wide range of other information which was outside the scope of my coursework investigation. I obtained my Primary data from members of the public, who were using "The Galleries" shopping arcade in Wigan. I collected the data by means of a sample questionnaire, which was carried out on the afternoon of Wednesday 29th September 1999. I will present my Secondary Data by means of line graphs, bar charts, pie charts, box and whisker diagrams and scatter diagrams. I will obtain Spearman's Correlation Coefficients and Mean and Standard Deviations.

Foundation Degree Computing - Statistical Methods
Statistical Methods By Miles Parker December 2004 Foundation Degree Computing - Statistical Methods Somerset College of Arts and Technology University of Plymouth Table of Contents Designing the Questionnaire 3 Collecting the Data 4 Data Analysis 6 Population Parameters 7 Predictions for the Next General Election 11 Limitations of the Survey 12 Location 12 Population 12 Quality of survey 12 Random Sampling or self selected data 12 Personal Questions 13 How did the Group Work? 14 Appendices 15 Appendix (A) Graphical Representation of Data 15 Appendix (B) Questionnaire 21 Designing the Questionnaire In order to design the questionnaire as a group we had to combine our thoughts and develop a questionnaire that would maximise the proportion of subjects answering the questionnaire, and obtain accurate relevant information. We decided to include questions that would prompt a response from the subject in a closed and open manner. Short simple sentences were used to minimise the subjects' confusion, we avoided negative questions where possible. We designed questions to minimise bias and we did decided to include some questions that have a grading value from 1-5. The question regarding the most important issues we allowed multiple answers to this as the subjects usually had more than one issue at the forefront of their concern e.g. 1 subject could want