
Dimensional Modeling
Dimensional Modeling (With modeled examples of Inventory Management and HR Processes) Submitted To. Mr. Imran Khan Course Supervisor Advance Databases Submitted By. Mr.Kamran Ellahi FA03-MS-0019 Mr.Mohd Hanif SP04-MS-0006 Introduction Business intelligence is the key achromous in today's competitive world of business and Data Warehousing the approach for achieving this level of intelligence about your business from your business. For years, data management people believed that there was only one real, persistent level of data - the operational level. All other data, while accepted, was derivable from this level. This is not true as there are several levels of data within an organization. The reason stems not from information technology (IT), but from business. Classically, there are three major levels of management and decision making within an organization: operational, tactical and strategic (figure 1). While these levels feed one another, they are essentially distinct. Operational data deals with day-to- day operations. Tactical data deals with medium-term decisions. Strategic data deals with long- term decisions. Decision making changes as one goes from level to level. At the operational level, decisions are structured. This means they are based on rules. (A credit card charge may not exceed the customer's credit limit.) At the tactical level, decisions

A practical using SPSS
Practical One A sample of 83 students was measured for their physical characteristics. The variables were as follows, classified as either quantitative or categorical : Height - Quantitative Weight - Quantitative Armlen- - Quantitative Uarm - Quantitative Lowera - Quantitative Legl - Quantitative Waist - Quantitative Hip - Quantitative ethnicity Frequency Percent Valid Percent Cumulative Percent Valid European 36 43.4 43.4 43.4 Asian 25 30.1 30.1 73.5 African 3 5.7 5.7 89.2 other 9 0.8 0.8 00.0 Total 83 00.0 00.0 Questions 2)i) The frequency table - The data shows the frequency and the percentage in the ethnicity sample. This also shows the highest and the lowest of both the frequency and percentage. Eg, European has a frequency of 36 and a percentage of 43.3, and the lowest is other ethnic groups of 9 and 10.8%. ii) Pie chart - Here the pie chart shows that the European ethnic group is large compared to other ethnic groups. This a visual reference as it contains no quantitative data. The pie chart also makes it easier to see which ethnic group is which by different colours. iii) Bar Charts - This Bar chart shows that the European ethnic group is the highest than any other ethnic group. It shows quantitative data by showing percentages. 3. A quick overview of the ethnicity is the best way to show a presentation, whereas

Ethical Decision-Making
Decision Support Systems Sharon Robinson DBM 410 Decision support Systems SPICS1101 University of Phoenix- Clearwater Campus Joe Dobrinski, Jr. May 31, 2005 Workshop #5 Team Assignment Creating a Decision Support System Creating a Decision Support System (DSS) A DSS is an interactive, computer-based system, which has functions for giving a user modeling and data support, which is flexible and adaptable to varying needs in changing environments, with a supportive and easy to use interface, and which has been built to represent the necessary and sufficient problem and knowledge elements of the context it should support (MacDermant, 1998). The ultimate goal of collecting this data is to provide a foundation for business intelligence. Data is drawn from data warehouses, data marts, internal data (generated by business transactions), personal data (individual, subjective estimates, projections, opinions, judgments, etc.), external data (generated outside the organization, but relevant to the organization), economic data (competitive intelligence), and any other data needed for sound decisions. We can collect data manually, by instruments and sensors, scanning, or electronic transfer. The data is transformed into information and knowledge. Data analysis tools are then applied which will augment the decision makers' judgment with facts, analysis, and forecasts. Practical

INFORMATION MANAGEMENT
COURSEWORK REPORT COURSE: INFORMATION MANAGEMENT COURSEWORK ID: CIT-3-INM IN PARTIAL FULFILMENT FOR THE AWARD OF BA/BSC DEGREE (BIT & MANAGEMENT) PREPARED BY STUDENT ID NUMBER: NOVEMBER 2008 INTRODUCTION Information can be managed in organisations so that it's potential for improving business performance and enhancing the competitiveness of the organisation can be realised by looking into aspects of organisations information. Information in an organisation is power because it is the key to the effectiveness and efficiency of how well organisation collects information and manages the information. It is the link between the history of the company and the future as the information management policy of an organisation could be the back bone of the company. In this age where information is very much valued, there is the need for strong information management systems for companies, this should be jealously guarded and secured, managed to the benefit of the company and the structure f the company in line with the organisation's line of business. THE ISSUES: . STRUCTURE OF SOFT AFRICA WEST (SAW) Soft Africa West organisation was established twenty years ago as a family business by two sisters with its head office in the UK where both founders lived at the time the business was founded. The main operation of the business is managed in the UK which serves as the head

How many squares are there on a chessboard?
How many squares are there on a chessboard? The aim of this investigation is to find out how many squares and rectangles of specific sizes can be found on a chessboard, and too see if there is a common sequence and algebraic formulae for each example. I have started with the simplest example that is to count the different combinations of squares on a range of boards from 2x2 board up to an 8x8 board. Results from the count 2x2 board x1=4 2x2=1 3x3 board x1=9 2x2=4 3x3=1 4x4 board x1=16 2x2=9 3x3=4 4x4=1 5x5 board x1=25 2x2=16 3x3=9 4x4=4 5x5=1 6x6 board x1=36 2x2=25 3x3=16 4x4=9 5x5=4 6x6=1 7x7 board x1=49 2x2=36 3x3=25 4x4=16 5x5=9 6x6=4 7x7=1 8x8 board x1=64 2x2=49 3x3=36 4x4=25 5x5=16 6x6=9 7x7=4 8x8=1 When the 8x8 boards results are analyzed a quadratic sequence can be identified i.e the second difference is a constant. term No of squares st diff 2nd diff 64 2 49 5 3 36 3 2 4 25 1 2 5 6 9 2 6 9 7 2 7 4 5 2 8 3 2 Using the general term for a quadratic sequence where A= 1/2 the constant 2nd difference, which is 2x 1/2 = 1 Yn=An + Bn + C So y1 = 1x1 + B x 1 + C = 64 So B + C = 64 - 1 B + C = 63 Y2 = 1x2 + B x 2 + C = 49 4 + 2B + C = 49 so 2B + C = 45 we now solve the simultaneous equation B + C = 63 2 B + C = 45 ?- B = 18 OR B = - 18 if B = - 18 then C = 63 - (-18)=81 so the

To be or not to be Molière: that is the latest questionwreaking havoc among French academics.
To be or not to be Molière: that is the latest question wreaking havoc among French academics. In "Corneille in the Shadow of Molière," a book recently published in France, Dominique Labbé, a specialist in what is known as lexical statistics, claims that he has solved a "fascinating scientific enigma" by determining that all of Molière's masterpieces - "Le Tartuffe", "Dom Juan," "Le Misanthrope," value="148422">"L'Avare" - were in fact the work of Pierre Corneille, the revered tragedian and acclaimed author of "Le Cid." "There is such a powerful convergence of clues that no doubt is possible," Mr. Labbé said. The centerpiece of his supposed discovery is that the vocabularies used in the greatest plays of Molière and two comedies of Corneille bear an uncanny similarity. According to Mr. Labbé, all these plays share 75 percent of their vocabulary, an unusually high percentage. Mr. Labbé's claim has upset more than the insular world of scholars. In the French collective consciousness, Molière is perceived as something of a national Shakespeare. Written in large part for Louis XIV and his court, Molière's comedies instantly became symbols of French culture thanks to their extraordinary dramatic range and extensive popular and scholarly appeal. As Joan Dejean, a professor of 17th-century French literature at the

internal and external program interfaces
Design of external and internal program interfaces The layout of the system is as follows. On the login screen there will be a space for which the user can enter their username and password. This is required in order to enter the system. When the box is clicked on by the user using the mouse, a flashing cursor will appear to show that it is really to type. This ensures that the user is aware of what is happening and makes it user friendly. The screen is uncluttered and has a login and cancel bottom to assist the user in the login of the system. This is shown to the right hand side. Once a login sequence has been completed and accepted by the system which matches it to a database that contains the correct usernames and passwords, the system then connects to the next screen where the bookings of shows can take place. From there on in, all the screens will look the same with just different instructions. This is to ensure consistency within the application as so not to confuse or distract the user. The logo will appear in the top right hand corner and the management button just below it. This will allow only the manager to view information that is suitable for him e.g. sales figures. This will not be allowed to be viewed by staff members by using a hierarchy system of usernames and passwords at the login stage. The first page shows a drop down menu by which the user can select

The objective of this project is to investigate whether prices in stock markets follow a weak form efficient process.
TABLE OF CONTENTS INTRODUCTION 2 2 DATA AND METHODOLOGY 2 2.1 JARQUE-BERA STATISTICS FOR NORMALITY 4 2.2 LJUNG-BOX STATISTICS FOR SERIAL CORRELATION 5 2.3 AUGMENTED DICKEY-FULLER TEST OF UNIT ROOT 5 2.4 RUNS TEST FOR RANDOMNESS 6 3 RESULTS AND DATA ANALYSIS 7 3.1 DESCRIPTIVE STATISTICS 7 3.2 RESULTS FROM JARQUE-BERA NORMALITY TEST 10 3.3 RESULTS FROM LJUNG-BOX STATISTICS FOR SERIAL CORRELATION 11 3.4 RESULTS OF ADF TEST FOR UNIT ROOT 14 3.5 RESULTS OF RUNS TEST FOR RANDOM WALKS 16 4 CONCLUSION 18 Introduction The concept of 'efficient' stock market has been hotly debated ever since Eugene Fama first introduced it around some thirty years ago. Under the weak form of market efficiency, the price of a security reflects all the available information about the economy, the market and the specific security, and that prices adjust immediately to new information. For a long time the conformation of random walk is considered to be a sufficient condition for market efficiency. However, rejection of random walk model does not necessarily imply the inefficiency of stock-price formation. Random walk is the path of a variable over time that exhibits no predictable patterns at all. If a price, p, moves in a random walk, the value of p in any period will be equal to the value of p in the period before, plus or minus some random variable. The random walk hypothesis states that

Lifecycle Management Of Information Technology Project In Construction
Running Head: LIFECYCLE MANAGEMENT Lifecycle Management Of Information Technology Project In Construction [Name of the writer] [Name of the institution] Ab?tract Change? brought about from progre??e? in information and communication technology for architecture, engineering, and con?truction indu?trie? (con?truction ICT) are not purely mechanical, but mu?t be accompanied by change? to management proce??e?. El?ewhere, we have di?cu??ed the framework for project information management in con?truction. Thi? paper addre??e? change? to perform of project management a? the whole. Generally, it ?ugge?t? the unified approach to project management that involve? defining the put of widely-applicable wide?pread view? of project information, overtly defining inter-relation?hip? between information in the?e diver?e view?, and modifying project management tool? and procedure? to exertion with the?e integrated view?. Table of Content Ab?tract ii CHAPTER 1: INTRODUCTION 1 Background of re?earch 1 Problem ?tatement 1 Rationale 1 Aim? 12 Objective? 12 ?ignificance 12 Hypothe?i? 13 Theoretical Frame work 13 Limitation of ?tudy 15 Reliability 15 Validity 16 Ethical Concern 17 CHAPTER 2: LITERATURE REVIEW 19 Modeling development lifecycle 19 Modeling lifecycle for complex product development 19 Complexity and interdependencie? in con?truction project? 110 View? and
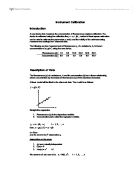
Instrument Calibration.
Instrument Calibration Introduction A new device that measures the concentration of fluorescence requires calibration. The device is calibrated using the calibration line, method of least square estimation can be used to estimate the parameters ? and ? and the validity of the estimates using measurement readings from observed data. The following are the measurements of fluorescence y, of a substance, A, in known concentrations x in ?g/m3, using the new device. Fluorescence (y) .0 8.0 6.0 24.0 32.0 38.0 Concentration (x) 0.0 2.0 4.0 6.0 8.0 0.0 Description of Data The fluorescence (y) of a substance, A and its concentration (x) has a linear relationship, where concentration (x) increases as fluorescence (y) of the substance increases. A linear model will be fitted to the observed data. The model is as follows: Straight-line regression . Fluorescence (y) is the dependent variable 2. Concentration (x) is called the regressor variable. 1, 2, ... , n here = e = Error ei is the error in the ith observation yi. Assumption on the errors . {ei} are mutually independent 2. E(ei) = 0 3. Var(ei) = ?2 We assume ei's are normal i.e. ei ~ N(0, ?2) 1, 2, ... , n Regression by Formula By using a mathematical method called the "Method of Least Squares" it is possible to find the values of ? and ? for in order to find a regression line. The least


