The following reactions will take place in these experiments:
and
Experimental
In a round bottom flask, NH3(tBu)+ Cl- (1.316 g) and THF (15 mL) were mixed. With steady stirring, powdered NaBH4 (0.20 g) was added to the suspension. Additional THF (10 mL) was added to the solution. The solution was then stirred at room temperature for 2 hrs. Then the solution was filtered with a suction filter apparatus. The filtered THF solution was evaporated using a rotary evaporator. The melting point of the product was determined. The percent yield of the product was calculated. The IR spectrum of the product was measured in CDCl3. The same procedure was repeated using NaBD4 (0.2092 g) in place of NaBH4.
Results
The theoretical yield was calculated for H3B-NH2(C4H9):
And the percent yield was calculated for H3B-NH2(C4H9):
The theoretical yield was calculated for D3B-NH2(C4H9):
And the percent yield was calculated for D3B-NH2(C4H9):
The melting point for H3B-NH2(C4H9) was recorded to be between 95ºC and 100ºC. The melting point D3B-NH2(C4H9) was recorded to be between 101ºC and 103ºC. Both adducts were white, clumpy powders.
Bond stretching frequencies were observed (νobserved) when measuring the IR spectrum of H3B-NH2(C4H9) and D3B-NH2(C4H9). Theoretical bond stretching frequencies (νtheoretical) were determined using Spartan software. The frequencies between H3B-NH2(C4H9) and D3B-NH2(C4H9) were then compared:
Table 1: Comparison of νobserved and νtheoretical IR data
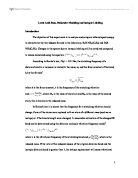
For each product, an IR was measured in CDCl3:
Figure 1: IR spectrum of H3B-NH2(C4H9) adduct.
N-H, B-H, and B-N observed frequencies are indicated.
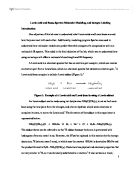
Figure 2: IR spectrum of D3B-NH2(C4H9) adduct.
N-H, B-H, and B-N observed frequencies are indicated.
The reduced mass differences were determined for the B-H stretch of H3B-NH2(C4H9):
and for the B-D stretch of the deuterated species:
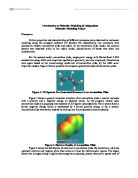
The structures HOMO (Figure 3) and LUMO (Figure 4) of BH3 and the HOMO (Figure 5) and LUMO (Figure 6) of NH2(C4H9) were determined using Spartan software. Using the same software, the energies of the HOMOs and LUMOs were recorded. For BH3, the energy of the HOMO was recorded as -1144.51 kJ/mol and the energy of the LUMO was recorded as 154.36 kJ/mol. For NH2(C4H9), the energy of the HOMO was recorded as -948.84 kJ/mol and the energy of the LUMO was recorded as 340.60 kJ/mol.
Discussion
The percent yield was calculated to be 232% for H3B-NH2(C4H9); the percent yield was calculated to be 137% for D3B-NH2(C4H9). Both of these yields are very high. It is very likely that the products were still very moist after being taken out of the rotary evaporator and that this contributed to the high actual and percent yields. The products were clumpy powders, rather than soft powders, and this was an indication that the product was most likely still too wet before the IR was measured.
The melting point for H3B-NH2(C4H9) was recorded to be between 95ºC and 100ºC. This is in accordance with expected values of about 96º C4. The melting point D3B-NH2(C4H9) was recorded to be between 101ºC and 103ºC. This makes sense, since the deuterated species of H3B-NH2(C4H9) is ever so slightly heavier, and would then boil at a higher temperature.
The reduced masses were calculated for H3B-NH2(C4H9), 0.92 amu, and for the deuterated species, 1.7 amu. The ratio of the reduced masses, 0.92/1.7, was less than 1, 0.54. This indicates that the isotopic replacement of deuterium for hydrogen causes the wavenumbers of the frequencies of the deuterated species to be lower than those of H3B-NH2(C4H9). This also makes sense when comparing the theoretical values in Table 1, where the frequencies for D3B-NH2(C4H9) were lower than those of H3B-NH2(C4H9). The observed frequencies, however, did not differ as they should have. This is probably due to impurities that may have been present in the IR sample, as well as scratches and the presence of other compounds on the salt plates used for the IR, which could have skewed the reading and the spectra.
The greatest downward shift of frequencies should be seen between the B—H bond of H3B-NH2(C4H9) and the B—D bond of D3B-NH2(C4H9). In the theoretical values, this is evident. The B—H frequency is expected to occur between 2350 cm-1 and 2650 cm-1.5 The observed frequency is just below this at 2256 cm-1 and the theoretical value is well above this at 3184 cm-1. Using the equation,
, the values of B—D stretching are estimated to occur between 1731 cm-1 and 1944 cm-1. The observed frequency is well above the value, as is the theoretical frequency. B—N bands typically occur from 1430 to 1335 cm-1. 6 The observed values in each species were far below this range, both at 925 cm-1. The theoretical values were well below this range, at 874 cm-1 and 844 cm-1. In IR spectra, N—H stretches typically occur between 330 and 3500 cm-1. 7 The observed frequencies fell just below this range, and the theoretical frequencies were within the range. Regardless of the discrepancies between accepted values, observed values, and theoretical values, the theoretical values still followed the expected trend in that the deuterated specie occurred at a lower frequency than that of the hydrogen specie.
The recorded energy of the HOMO of BH3 was lower than the recorded energy of the LUMO. The same trend was observed for the HOMO and LUMO of NH2(C4H9). Conventionally, the LUMO is higher in energy than the HOMO, which can be observed in a molecular orbital diagram as the LUMO is drawn above the HOMO and the HOMO is completely occupied, making it much more stable than the incompletely occupied LUMO.
Conclusion
The theoretical frequencies followed the expected trend of a downward shift or decrease in the deuterated adduct’s stretching frequencies, most notable in the B—H and B—D bands. The observed frequencies were not as expected and did not follow the same trend as the theoretical frequencies. To avoid these discrepancies in the future, the products should be left in the rotary evaporator for a longer period of time and/or they should be thoroughly dried in an oven to ensure that all moisture is lost. Also it is recommended that clean IR salt plates be used with minimal or no scratches.
References
(1) University of Colorado. Infrared Spectroscopy: Theory. .
edu/hndbksupport/irtutor/IRtheory.pdf (accessed Oct 12, 2010).
(2) Nataro, Chip; et al. Lewis Acid-Base, Molecular Modeling, and Isotopic Labeling in a Sophomore Inorganic Chemistry Laboratory. J. Chem. Education 2004, 81, pp 722-724.
(3) Atkins, P.; Overtone, T.; Rourke, J.; Weller, M.; Armstrong, F. Inorganic Chemistry, 4th ed.; Oxford University Press: Great Britain, 2006.
(4) Feigerle, J.; et al. Thermal decomposition of t-butylamine borane studied by in situ solid state NMR. J. Ceramic Transactions 2010, 78.
(5) Nakanishi, K; Solomon, P. H. Infrared Absorption Spectroscopy, 2nd ed.; Holden-Day, Inc.: Oakland, CA, 1977; pp 55.
(6) Pouchert, C.J. The Aldrich Library of Infrared Spectra, 2nd ed.; Aldrich Chemical Company, Inc.: Milwaukee, WI, 1975; pp 1323.
(7) University of Puget Sound Characteristic IR Absorption Frequencies of Organic Functional Groups http://www2.ups.edu/faculty/hanson/Spectroscopy/IR/
IRfrequencies.html (accessed Oct 12, 2010).
Figures
Figure 3: HOMO structure of BH3
Figure 4: LUMO structure of BH3
Figure 5: HOMO structure of NH2(C4H9)
Figure 6: LUMO structure of NH2(C4H9)