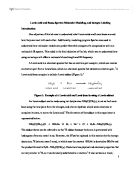
Molecular vibrations depend on the masses of the atoms, a relationship demonstrated in Hooke’s law (Equation 1). Therefore, a change in frequency caused by the substitution of 2H for 1H could also be predicted by Hooke’s law.
(Equation 1)
Hooke’s Law:
In the above equation, V represents the energy potential in the reaction, k is the force constant that is dependent on the mass of the species in question, and x represents the displacement from equilibrium.3
Using these concepts, IR spectra and the vibrations of the molecule can be predicted to show differences when comparing molecules containing hydrogen with those containing its deuterated form.
Experimental:
In a 50 mL round-bottom flask equipped with a stir bar, 1.318 g of NH3(tBu)Cl was added to THF (15 mL) . To this suspension powdered NaBH4 (0.208 g) was added. Then, additional THF (10 mL) was added, and the solution was stirred at room temperature. After two hours, the solution was filtered using a suction filter apparatus and filter paper, and then using a rotary evaporator. The filtrate with the THF was evaporated until only a dry product remained. The melting point was determined and the product yield was recorded. Finally, the product’s IR spectrum was measured in CDCl3. This procedure was then repeated using powdered NaBD4 (0.20 g) as a reagent instead of using powdered NaBH4.
For the computational portion of the experiment, Spartan was used to construct models for the following compounds: BH3, NH2(C4H9), H3B-NH2(C4H9), and D3B-NH2(C4H9). The calculations done for these models were carried out using the semi-empirical setting. The Spartan-generated IR was then used to predict the vibrations of the molecule. The frequencies of the following bands of the IR spectra were noted: B-H scissor and wagging, N-H scissor, C-H stretch (symmetric and asymmetric), B-H stretch (symmetric and asymmetric), N-H stretch (symmetric and asymmetric), and B-N stretch. Lastly, surface plots of the HOMO and LUMO orbitals were observed for the Lewis acid and Lewis base compounds. The orbital energy of each was recorded as well as the electrostatic charges of each atom.
Results:
From the experimental procedure, 0.335 g of H3B-NH2(C4H9) was yielded, giving a 70% yield, calculated from the equation for theoretical yield and percent yield shown below (Equation 2, Equation 3).
(Equation 2)
(Equation 3)
= 70% yield
The melting point for the first compound was 95-100°C, and the melting point of the compound containing deuterium was 101-103°C.
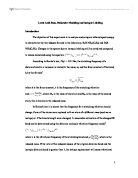
The table below summarizes the frequencies for the analyzed bands of interest on the IR (Table 1). It should be noted that in both the theoretical and observed cases, the adduct with the deuterium shows a higher wavenumber.
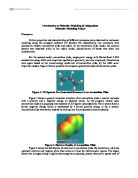
The experimental IR spectrum for the 1H adduct is shown below followed by the 2H spectrum (Figure 2, Figure 3). The bands between 3300-3500 cm-1 reflect the N-H stretches. The C-H stretches are between 2850-3000 cm-1, and the B-H stretches are also near this band. At the right end of the graph are located the B-N stretches between 750 – 900 cm-1.
Figure 2: Experimental IR for the Hydrogen adduct
The IR below shows the experimental spectra for the deuterated adduct (Figure 3).
Figure 3: Experimental spectra for Deuterium adduct
The spatial representations of the HOMO and LUMO orbitals are shown below for the compound NH3(C(CH3)3) (Figure 4).
Figure 4: HOMO orbital (left) and LUMO orbital (right) of NH3(C(CH3)3)
The spatial representations of the HOMO and LUMO orbitals for BH3 are also shown below (Figure 5).
Figure 5: HOMO (left) and LUMO (right) orbitals of BH3
Discussion:
The 1H adduct of the Lewis acid and base pair of this experiment produced a 70% yield of product, with a melting point range of 95-100°C. This agrees with the literature value of 96-101°C.4 The melting point of the 2H adduct was found to have a slightly higher range of 101-103°C.
As predicted, the IR spectra of molecules containing the isotope deuterium had differences compared to those with only 1H. The B-N stretch was had a higher wavenumber value in the deuterated compound. This is a result of deuterium’s atomic mass being twice that of 1H. The experimental spectra for the adducts had similar values to what had been predicted in Spartan. However, there was a slight discrepancy between the computational IR from Spartan and the experimental IR which could be attributed to the fact that Spartan’s calculations assume that the compounds are in the gas phase. 5 Furthermore, the Spartan-generated IR does not take into account any interactions that may have occurred with the solvent.
The special representations of the HOMO and LUMO orbitals of each reactant, further show why a Lewis adduct can be made so easily by these two compounds. Figure 4 shows the prominent HOMO where the lone pairs stick out from the nitrogen, making the electrons easily donated to the Lewis acid in this reaction, which is BH3. Furthermore, the LUMO of the BH3 are apparent by the lobes radiating from the central atom, boron. The combination of these two compounds, creates the Lewis adduct.
Conclusion:
The objective of this lab, which was to understand what Lewis acids and Lewis bases are and how they can react with each other, was met. Additionally, modeling program Spartan was used to understand how molecular models can predict favorable energies of a compound as well as a molecule’s IR spectra. This aided in the final objective of the lab, which was to understand how using an isotope will affect a molecule’s bond length and IR spectrum. The different atomic masses will change the vibrations and frequencies that are represented in the IR.
References:
1. Atkins, P.W.; Overton, T.L.; Rourke, J.P.; Weller, M.T.; Armstrong, F.A. Inorganic Chemistry,4th Ed.; W.H. Freeman and Company: New York, 2006.
2. IUPAC. Compendium of Chemical Terminology, 2nd ed. (the "Gold Book"). Compiled by A. D. McNaught and A. Wilkinson. Blackwell Scientific Publications, Oxford (1997). XML on-line corrected version: http://goldbook.iupac.org (2006-) created by M. Nic, J. Jirat, B. Kosata; updates compiled by A. Jenkins. ISBN 0-9678550-9-8..
3. Girolami, G. S.; Rauchfuss, T. B.; Angelici, R. J. Synthesis and Technique in Inorganic Chemistry, 3rd ed.; University Science Books: Sausalito, 1999; pp 47-53.
4. Borane-tert-butylamine complex; MSDS No. 54706 [Online]; Fisher Scientific: Fair Lawn, NJ, Jan 16, 2007. https://fscimage.fishersci.com/msds/54706.htm (accessed Oct 14, 2010).
5. Montgomery, C. D. J. Chem. Educ. 2001, 78, 840.