A way of deciding how to put the social-economic characteristics into different categories was to rank each ward for the variables above. This can be seen in my data representation and analysis. This way I could see which ward overall had the best social-economic characteristics. Also from it I could see whether the above theory was correct.
Environmental Characteristics
This only includes to variables. Both are listed below and the theory is given.
Air pollution; A ward with a high level of pollution will have poor environmental characteristics, whereas a ward with a low pollution level will have good environmental characteristics.
Noise pollution; Wards with a higher noise pollution will have worse environmental characteristics.
Again I ranked each ward for the variables above. This way I could see which ward overall had the best environmental characteristics. I could also see whether the above theory was correct.
- Is there a variation between the outer-wards in terms of the social-economic status?
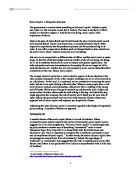
To answer this question I simply used my choropleth map of the social-economic characteristics. The map clearly showed a difference in characteristics among the outer-wards. Here are the overall ranking scores put into a table.
From looking at variables such as the average building quality score for each ward it can be seen that there is great variation within the wards. St Peter is quite often ranked highly, usually 1 or 2, throughout each of the variables, this is why it comes out with the best social-economic characteristics. Being ranked highly in each of the variables and having better social-economic characteristics supports my theory. However, wards such as St Martin regularly obtain a low ranking of about 6, 7, 8 throughout each of the variables, this is why it ended up with worse social-economic characteristics, this supports my theory mentioned on the page before.
- Is there a variation between the outer-wards in terms of quality of environment?
To answer this question I simply used my choropleth map of the environmental characteristics. The map clearly showed a difference in characteristics among the outer-wards. Here are the overall ranking scores put into a table:
As only two variables were used for this ranking system, it means that it is not that reliable and difficult to make overall generalisations about which ward has the better environmental characteristics. Nevertheless I have put these ranking scores onto a choropleth map which does show a difference amongst the wards in environmental characteristics.
Overall Conclusion
“Are there any variations in the social- economic characteristics & environmental characteristics between the outer-wards of Worcester?”
From both of the choropleth maps it can be seen that there are variations in the social-economic characteristics & environmental characteristics between the outer-wards of Worcester. Also as shown above this is not just at an overall level, variations amongst the wards can be seen within variables, and even within the wards themselves, such as the air pollution figures. St. peter was the outer ward that was found to be the ward with the overall best socio-economic and environmental characteristics, with St. John being the worst. My hypothesis that there will be a variation in terms of socio-economic and environmental characteristics was correct and is accepted. My results clearly support this conclusion that such a variation exists.