that it would be nearly impossible to forecast the weather over a long period of time. After compiling and analyzing his unbelievable findings, Lorenz then developed three equations from the field of fluid dynamics to represent his results graphically.
x' = 3(y - x)
y' = -xz + 26.5x - y
z' = xy - z
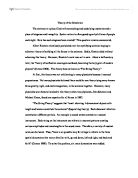
When he graphed these on a three-dimensional plane, the equations demonstrated the characteristics of a chaotic system exactly. The graph was both ordered and chaotic at the same time. The equations resulted in a graph that looped back and forth, but never crossed or settled down to a single point (Rae n.p.). This graph came to be known as the Lorenz Attractor, and proved that seemingly chaotic and random systems could show order in their results (Donahue).
Lorenz Attractor
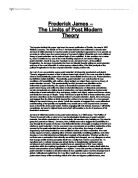
After discovering the workings of chaos in his attractor, Lorenz experimented with a new concept involving his new theory to support his findings in chaos, a waterwheel. His equations that he had previously graphed dealt with convection yet also strangely seemed to describe the pattern of a simple waterwheel. After numerous trials, he found that without even varying the speed of the water flow, he could produce an entirely chaotic system with the waterwheel, where the buckets changed speed and direction seemingly randomly (Gleik 27).
“At the top, water drips steadily into containers hanging on the wheel's rim. Each container drips steadily from a small hole. If the stream of water is slow, the top containers never fill fast enough to overcome friction, but if the stream is faster, the weight starts to turn the wheel. The rotation might become continuous. Or if the stream is so fast that the heavy containers swing all the way around the bottom and up the other side, the wheel might then slow, stop, and reverse its rotation, turning first one way and then the other (Gleick 29).”
Lorenz Waterwheel
Together, the Lorenz Attractor and the Lorenz Waterwheel helped to establish the foundations for the new science of Chaos. But to the science community’s despair, Lorenz’s discoveries would not be recognized for more than a decade, due to the fact that
his papers were published in an atmospheric science journal that received hardly any recognition. After all, he was just a meteorologist.
Another modern area to which chaos theory can be applied to is fractal geometry. Fractal geometry was first introduced by the French mathematical physicist Benoit Mandelbrot. Mandelbrot first utilized the concept of fractal geometry when he inquired, “How Long is the Coastline of Great Britain?” in Nature magazine. In the article, he challenged the conventional method of mathematicians at the time, which was to approximate the length with a polygonal path around the country. However, Mandelbrot realized that as finer and finer resolutions of the coastline were analyzed, the total perimeter seemed to grow infinitely. He predicted that the coastline was in fact in fractal dimensions since it was entirely rough on all scales. To answer the question would require using the complex equations involved in fractal geometry. Zaodin and Iwona Abrams claim that his discovery played a key-role in the emergence of chaos theory (28). Donahue explains that fractal geometry is quite different from the standard Euclidian geometry that is taught in schools. He states, “…fractal geometry concerns nonlinear, nonintegral systems while Euclidian geometry is mainly oriented around linear, integral systems” (n.p.). This means that instead of describing lines, fractal geometry is used to describe complicated algorithms. Fractals are created by taking certain complex equations and iterating them over and over until they eventually form an intricate and
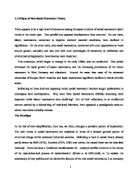
intriguing image. There are two basic principals involved in the creation of fractals. First, as Donahue clarifies, fractals are self-similar (n.p.). This means that no matter how many times the image is magnified, it looks the same on all levels. Also, fractals have dimensions that include imaginary numbers, or that are non-integer. This is another aspect that makes them different from ordinary linear graphs. Some of the most basic fractals, such as the Sierpinski Triangle and Kotch Snowflake, are formed from equilateral triangles and can be performed by hand or using a simple graphing calculator. The Sierpinski Triangle is formed by repeatedly connecting the midpoints of an equilateral triangle.
Sierpinski Triangle
The Koch Snowflake is created by adding new triangles to the sides of an existing triangle.
Koch Snowflake
These are just a few of the simplest fractals. Fractals can become very complex, like the Mandelbrot set and Julia set, yet only simple computers are required to perform the infinite iterations. Donahue believes that fractals are more appreciated for their beauty and intricate designs rather than their mathematical importance (n.p.). The general public view fractals as fascinating, yet simple computer generated pictures. Many do not recognize the intricate mathematical principals that are behind the aesthetically pleasing image.
The major figures that played a role in discovering the concept of fractal geometry are Gaston Maurice Julia and Benoit Mandelbrot. Together, they produced some of the most easily recognizable fractals. Gaston Maurice Julia, born in Algeria and injured during World War I, dedicated his life to researching the iteration of functions. Despite his hard work, much of his research and findings on the topic were forgotten until 1970, when Benoit Mandelbrot re-discovered his work. According to Mendelson and
Blumenthal, Mandelbrot “…believed that fractals were found nearly everywhere in nature, at places such as coastlines, mountains, clouds, aggregates, and galaxy clusters” (n.p.). Mandelbrot was an important precursor in the furthering of chaos into other areas of math and science. Due to much of his work, fractals were even applied to real-life world applications. Two of the largest areas of science that fractals apply to are the worlds of medicine and biology. For example, fractals have been found on the surfaces of proteins within the human body (Donahue n.p.). Even the difficulty of describing and analyzing the complex irregular morphologies in tissues and cells during disease are believed able to be surmounted by the use of fractal geometry.
According to Rae, chaos also can be applied to areas outside of science. He states that chaos is used in computer generated art, and even music. The Lorenz Attractor has even been used to create variations on classical pieces. At the moment, it is being postulated that there are chaotic characteristics in the stock market. The goal of chaos theory is to explain non-linear dynamic systems. The stock market is an example of one of these types of systems, with shares running in either cycles or sets of cycles. These cycles form the base of an algorithm and by inputting the closing prices of any given share over a period of time the algorithm can determine all the possible cycles that exist by using the appropriate fractals. Once all the cycles have been found the strongest cycle can be calculated by using basic algebra. Therefore, the behavior of any given share over any span of time can be rather accurately predicted. While stock market predictions based on chaotic concepts can be made due to the regularly evolving patterns, long term predictions are practically useless.
So now that we have an acceptable definition of what chaos is, we can start to somewhat grasp this wide-encompassing concept. For reasons of simplicity, there is no need to go into depth about the technical aspects of chaos theory. The breadth of topics that the theory is applied to is so amazingly broad, that with only a general idea of the implications related to chaos, one can understand the function of chaos in modern subjects. The most general of world applications were discovered just as chaos theory was emerging.