
Math Studies - IA
IB MATHEMATICAL STUDIES Internal Assessment "An investigation into the value of Ryder Cup as a reflection of the US and Europe's comparative strength in the sport of golf." Peter Frederiksen Svane St. Mary's International School IB Candidate Number: 000134 - 039 March 10th, 2008 INTRODUCTION The Ryder Cup takes place every other year in September, and is supposed to determine whether Europe or the US is the best in the sport of golf. Each side is represented by twelve golf players, who get the chance to play against each other over the course of three days. Contrary to regular tournaments, the Ryder Cup is played in a match play format1 rather than using stroke play2. The question therefore arises if the Ryder Cup is a true reflection of which region (US or Europe) has the best group of golfers. Are Europeans really better golfers than Americans, since they have won all the meets since the new millennium? To put a final answer to this debate, the investigation will focus on performances in regular tournaments, in which the Ryder Cup players have all competed, and their performance in the Ryder Cup. Various mathematical processes will be carried out within the scope of relevance in order to reach a conclusion to the mentioned task. The performance of the Ryder Cup team players in regular stroke play tournaments on their seasonal tours, where the players come in direct

Logarithm Bases Math IA
Logarithmic Sequences IA Andrew Cherny Math SL Scott Learned /26/11 In math class, I was given the assignment to evaluate multiple logarithmic sequences to see if any patterns were evident within these sequences. Using logarithmic rules that I previously learned in math class, I was able to discover multiple patterns within each logarithmic expression. To begin, I was given the general logarithmic expression: ,... In order to establish patterns within this general logarithmic expression, I will use multiple examples to help establish a common pattern between all the examples. The first sequence is as followed: ,... Next, the same logarithmic sequence will be evaluated but more in depth, to try and find a common pattern. Note: a pattern is already starting to show. While the numerator stays the same throughout the logarithmic sequence, the denominator increases linearly by one. The pattern is also evident within these next two examples of logarithmic sequences. ) 2) Cleary, the pattern is noticeable as the sequence goes on. Therefore, I was able to find the term for each sequence, writing it in the form where . For the general logarithmic sequence, the term is the following. ..., That being the case, the nth term for the three examples of logarithmic sequences are the following: 1) 2) 3) To justify my answer using technology, I used excel to

Math IA -Modelling Population Growth in China.
Math IA Year Population in Millions 950 554.8 955 609.0 960 657.5 965 729.2 970 830.7 975 927.8 980 998.9 985 1070.0 990 1155.3 995 1220.5 In this set of data, the x axis is the year that the population was measured. The Y axis is the population in millions of China. In this set of data the population before the year 1950 is not listed so that does not mean that the data before 1950 does not exist it just means that for the purposes of this investigation they are irrelevant. The time period or range of the data is only from the years 1950 to 1995, this limits the amount of data points we have, and restricts the overall trend of the graph that we can see. Instead of seeing the data from year 0, we only see it from 1950 to 1995. When you view this specific section of data, it will have a different function that fits it than would the entire data set. This graph looks to be almost linear. The data looks to be almost arranged in a straight linear graph. This data looks to have almost the same slope or close to the same slope for all the data points. It is of course not perfectly linear because the growth of a population would not be perfectly linear. This data is close to linear but it is not perfectly linear. A linear function is plausible. This is a graph with the data points on it as well as a

SL Math IA: Fishing Rods
Math Summative: Fishing Rods Fishing Rods A fishing rod requires guides for the line so that it does not tangle and so that the line casts easily and efficiently. In this task, you will develop a mathematical model for the placement of line guides on a fishing rod. The Diagram shows a fishing rod with eight guides, plus a guide at the tip of the rod. Leo has a fishing rod with overall length 230 cm. The table shown below gives the distances for each of the line guides from the tip of his fishing rod. Guide Number (from tip) 1 2 3 4 5 6 7 8 Distance from Tip (cm) 10 23 38 55 74 96 120 149 Define suitable variables and discuss parameters/constraints. Using Technology, pot the data points on a graph. Using matrix methods or otherwise, find a quadratic function and a cubic function which model this situation. Explain the process you used. On a new set of axes, draw these model functions and the original data points. Comment on any differences. Find a polynomial function which passes through every data point. Explain you choice of function, and discuss its reasonableness. On a new set of axes, draw this model function and the original data points. Comment on any differences. Using technology, find one other function that fits the data. On a new set of axes, draw this model function and the original data points. Comment on any differences. Which of you

MATH Lacsap's Fractions IA
Mathematics SL Internal Assessment Type I By Claudia Cheng Introduction In this task, the goal is to consider a set of numbers which are presented in a recurring, symmetrical pattern and to find the general statement for En(r) be that the (r+1) th element is in the nth row and starting with r=0. Figure 1: Lacsap’s Fractions At first glance, I quickly noticed that the word “Lacsap” is “Pascal” spelt backwards. Therefore, the numbers presented in Figure 1 has a strong resemblance to Pascal’s Triangle. Figure 2: Pascal’s Triangle[1] Finding the general statement for numerators Upon observing Pascal’s Triangle, I noticed that the numbers on the third diagonal row, as highlighted with a blue box, in Figure 2 are the same as the numerators in Lacsap’s fractions in Figure 1. For example, the first number is 1, the second is 3, the third is 6, the fourth is 10 and the fifth is 15. These set of numbers are known as triangle numbers. Triangle numbers enumerate the items that can be arranged in a triangle. Thus, this is useful in founding the patterns in Lacsap’s Fractions. Looking at Pascal’s Triangle, we can then assume the numerator for the sixth row to be 21. The seventh row can be assumed to be 28 and the eighth row can be assumed to be 36 and so forth. To prove these assumptions, Table 1 below will be used to analyse the pattern of the
Math IA patterns within systems of linear equations
Math HL Investigation – Maximilian Stumvoll Math HL Investigation Patterns within Systems of Linear Equations Maximilian Stumvoll 1/11/2012 LIS ________________ Part A We consider this 2 x 2 system of linear equations: x+2y=3 2x-y=-4 Looking at the coefficients in the first equation (1, 2, 3) we notice a pattern. Adding 1 to the coefficient of x (1) gives the coefficient of y (2) and adding 1 once more gives the constant (3).A similar pattern exists in the second equation. Only, here we add -3 to the coefficients. We can say the coefficients follow an arithmetic sequence (AS). An arithmetic sequence has a common difference (d). This is the difference between two consecutive terms of the sequence. The first equation has a first term (a) of 1 and a common difference (d) of 1. The second equation has a first term (b) of 2 and a common difference (e) of -3. In order to solve this system of equations with the method of solving simultaneous equations by elimination, we need to multiply the first equation by 2. Then we can subtract the second equation from the first equation: As proof we can solve the simultaneous equations by the method of substitution. Rewriting the first equation as and substituting for x in the second equation gives: . This we can solve for y: Substituting this y-value into the second equation gives: Solving for x gives: Therefore the

Math IA- Type 1 The Segments of a Polygon
Math IA- Type 1 The Segments of a Polygon Abhinav Jain IB Higher Level Assignment: Internal Assessment Type 1: Modeling Mr. Murgatroyd Date: 15/03/2009 Word Count: . In an equilateral triangle ABC, a line segment is drawn from each vertex to a point on the opposite side so that the segment divides the side in the ratio 1:2, creating another equilateral triangle DEF. a) i) ii) Measurements and drawing shown above has been made through the Geometer's Sketchpad package. Measure of one side of the ?ABC = 12cm Measure of one side of the ?DEF = 5cm iii) The areas have also been calculated using the Geometer's Sketchpad package and are show in the diagram above. For ?ABC = 62.5cm2 For ?DEF = 8.8 cm2 In order to find the ratio, one needs to divide the area of ?ABC by the area of the ?DEF which will give one the ratio of the area of the bigger triangle to the smaller triangle. Therefore 62.5cm2 ÷ 8.8 cm2 = 7:1 The ratio between the areas of the equilateral ?ABC to ?DEF when the segment divides the side in the ratio 1:2 is 7:1. b) In order to repeat the procedure above for at least two other side ratios, 1: n The two ratios chosen are 1:3 and 1:4 for no specific reason. Ratio of Sides = 1:3 Again, the diagram above and values were obtained and created using Geometer's Sketchpad Package. For ?ABC = 62.0 cm2 For ?DEF = 19.1 cm2 In order to find the
Math Ia circles
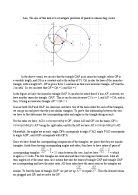
Aim: The aim of this task is to investigate positions of points in intersecting circles In the above visual, we can see that the triangle OAP is an isosceles triangle, where OP is a variable length, and OA is a constant and is the radius of C1. OA is also the base of the isosceles triangle, with a length of 1. OP is given to be 2, and seen as this is an isosceles triangle, AP must be 2 as well. So we can state that OP = OA = 2 and OA = 1. In the figure we have the isosceles triangle OAP. It can also be noted that if a line AP’ is drawn, we have another isosceles triangle: OAP’. This is can be seen because C1’s r = 1, and AP’ = OA, and in turn, it being an isosceles triangle AP’ = OA = 1. Seen as both OAP and OAP’ are isosceles, and have two of the same sides for each of the triangles, we can go on and prove that they are similar triangles. To prove this relationship between the two, we have to first determine the corresponding sides and angles in the triangle doing as such: For the sides we have: AO is corresponding to OP’, where AO and OP’ are the bases, OP is corresponding to AP’ being the right sides, and for the left we have AP corresponding to AO. Meanwhile, the angles are as such: angle OPA corresponds to angle P’AO, angle P’AO corresponds to angle AOP’, and AOP corresponds with OP’A. Once we have found the corresponding

Math IA - Logan's Logo
IBO INTERNAL ASSESMENT LOGAN'S LOGO MATHEMATICS SL TYPE II INTRODUCTION Logan has designed the logo at the right. The diagram shows a square which is divided into three regions by two curves. The logo is the shaded region between the two curves. He wishes to find mathematical functions that model these curves. In order to find these functions, we will need to overlay the logo on graph paper, so we can interpret data points to be able to plot them. Take note that in the "modeling the data" in the next section, the logo was not resized, but set as transparent so that data points could be read. Also, take into consideration the uncertainty of the measurements (± 0.25 units). For modeling purposes, the uncertainties are not included in the data calculations; however this should not be overlooked. MODELING THE DATA NOTE: Data tables and their graphs are included on the next page. TOP CURVE : In order to find a function to model the top curve, there are various methods that we can use. One is to overlay the logo onto a set of axes and estimate points for the function. Once we obtain these points, we can then plot them onto a new set of axes. Judging from the logo itself, at first glance it appears that a sine function would fit the data. The sine function would have to undergo a series of transformations to eventually fit the curve. Using the axes and logo depicted

Math IA Logarithm bases
Logarithm Bases Consider the following sequences. Write down the next two terms of each sequence. Log 2 8 , Log 4 8 , Log 8 8 , Log 16 8 , Log 32 8 , Log 64 8 , Log 128 8 Log 3 81 , Log 9 81 , Log 27 81 , Log 81 81 , Log 243 81 , Log 729 81 Log 5 25 , Log 25 25, Log 125 25 , Log 625 25, Log 3125 25 , Log 15625 25 Find an expression for the nth term of each sequence. Write your expressions in the form P/Q. Log 2 8 , Log 4 8 , Log 8 8 , Log 16 8 , Log 32 8 , Log 64 8 , Log 128 8 This sequence can be expressed 3/N. N being the nth term of the sequence. 1st Log 2 8 = 3 3/1 = 3 2nd Log 4 8 = 1.5 3/2 = 1.5 3rd Log 8 8 = 1 3/3 = 1 4th Log 16 8 = .75 3/4 = .75 5th Log 32 8 = .6 3/5 = .6 6th Log 64 8 = .5 3/6 = .5 7th Log 128 8 = .43 3/7 = .43 Find an expression for the nth term of each sequence. Write your expressions in the form P/Q. Log 3 81 , Log 9 81 , Log 27 81 , Log 81 81 , Log 243 81 , Log 729 81 This sequence can be expressed 4/N. N being the nth term of the sequence. 1st Log 3 81 = 4 4/1 = 1 2nd Log 9 81 = 2 4/2 = 2 3rd Log 27 81 = 1.33 4/3 = 1.33 4th Log 81 81 = 1 4/4 = 1 5th Log 243 81 = .8 4/5 = .8 6th Log 729 81 = .66 4/6 = .66 Find an expression for the nth term of each sequence. Write your expressions in the form P/Q. Log 5 25 , Log 25 25, Log 125 25 , Log 625 25, Log 3125 25 , Log 15625 25 This


