The table also indicates through the R² value, that on average, around 83% of the Key Stage 2 results are affected by the IQ, which shows there is a very strong relationship between the average Key Stage 2 results and the IQ.
Now I will look at only the females.
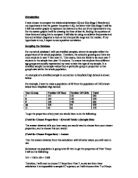
The following scatter graphs represent data from my female subset
The above scatter graph shows female pupils’ IQ and average Key Stage 2 results. It has a median positive correlation, which means that the greater the IQ, the greater the average Key Stage results. The R² value, which is 0.55, indicates that 55% of the average Key Stage 2 results are affected by the IQ.
This scatter graph displays female pupils’ IQ and Key Stage 2 English results. A weak positive correlation is seen, which relates to the relationship between the IQ and English results – the greater the IQ, the greater the English results. This scatter graph has a R² value of 0.1877, which tells us that 19% of the English results are affected by the IQ.
This scatter graph illustrates female pupils’ IQ and Key Stage 2 Maths results, which possesses a median positive correlation shows that the greater the IQ, the greater the Maths results. This scatter graph has a R² value of 0.4017, indicating that 40% of the Maths results are affected by the IQ.
This scatter graph shows female pupils’ IQ and Key Stage 2 Science results. It shows a median positive correlation which therefore means that the greater the IQ, the greater the average Key Stage 2 results are. The R² value relates to the how the average Key Stage 2 results are effected by the IQ. Here we see that the R² is 0.4374 which shows that 44% of the Key Stage 2 Science results are affected by the IQ.
All these scatter graphs for the female pupils support my hypothesis that the greater the IQ, the greater the Key Stage 2 results will be. Therefore, (as I predicted) you see a positive correlation.
I have now placed the equations of the line of best fit and the R² values of these scatter graphs into a table.
By observing the gathered data in the table above, I noticed that the scatter graph showing the Key Stage 2 Science results are affected more by the IQ, than the Maths and English results.
The table also indicates through the R² value, that on average, around 55% of the Key Stage 2 results are affected by the IQ, which shows there is a median relationship between the average Key Stage 2 results and the IQ.
Now I will look at only the Year 7 subset.
The following scatter graphs represent data from the Year 7 subset.
This is a scatter graph illustrating Year 7 pupils’ IQ and average Key Stage 2 results, with a weak positive correlation, which indicates that the greater the IQ, the greater the average Key Stage 2 results. The R² value is 0.2394, which further shows that 24% of the average Key Stage results are affected by the IQ.
The scatter graph above shows Year 7 pupils’ IQ and Key Stage 2 English results. The weak positive correlation shows that the greater the IQ, the greater the Key Stage 2 results. The line of best fit has a R² value of 0.0053 which means that 0.53% of the IQ is affected by the Key Stage 2 English results.
This scatter graph, showing Year 7 pupils’ IQ and Key Stage 2 Maths results, has a weak positive correlation which shows that the greater the IQ, the greater the Key Stage 2 Maths results. The R² value (0.1454) relates to how much of the Maths results are affected by the IQ – which is 15%.
This scatter graph illustrates Year 7 pupils’ IQ and Key Stage 2 Science Results. The R² value (0.2673) measures the trend line’s correlation, which is a weak positive correlation – this shows that the greater the IQ, the greater the Key Stage 2 Science results are. The R² value indicates that 27% of the Key Stage 2 Science results are affected by the IQ.
All these scatter graphs support my hypothesis, that the greater the IQ, the greater the Key Stage 2 results.
I have now placed the equations of the line of best fit and the R² values of these scatter graphs into a table.
By observing the gathered data in the table above, I noticed that the scatter graph showing the Key Stage 2 Science results are affected more by the IQ, than the Maths and English results.
The table also indicates through the R² value, that on average, around 24% of the Key Stage 2 results are affected by the IQ, which shows there is a weak relationship between the average Key Stage 2 results and the IQ.
Now I will look at only the Year 8 subset.
The following scatter graphs represent data from the Year 8 subset.
This scatter graph shows Year 8 pupils’ IQ and average Key Stage 2 results. Here we see a strong positive correlation, with a R² value of 0.7359. These observations denote that firstly, the greater the IQ, the greater the average Key Stage 2 results. Secondly, (using the R² value) 74% of the average Key Stage 2 results are affected by the IQ.
The scatter graph above shows Year 8 pupils’ IQ and Key Stage 2 English results. This scatter graph has a strong positive correlation, which relates to the fact that the greater the IQ, the greater the Key Stage 2 English results. The R² value is 0.8844, which indicates that 88% of the Key Stage 2 results are affected by the IQ.
This scatter graph shows Year 8 pupils’ IQ and Key Stage 2 Maths results. There is a weak positive correlation which tells us that the greater the IQ, the greater the Key Stage 2 Maths results. We can acknowledge from the 0.1972 R² value that 20% of the Key Stage 2 Maths results are affected by the IQ.
This scatter graph shows a weak positive correlation in relation to Year 8 pupils’ IQ and Key Stage 2 Science results. This correlation shows that the greater the IQ, the greater the Key Stage 2 Science results. The R² value of this graph is 0.2793, which informs us that 28% of the Key Stage 2 Science Results are affected by the IQ.
All these scatter graphs support my hypothesis, that the greater the IQ, the greater the Key Stage 2 results. My hypothesis also involved the prediction of a positive correlation, which is seen throughout all the scatter graphs due to the relationship of the IQ and the Key Stage 2 results.
I have now placed the equations of the line of best fit and the R² values of these scatter graphs into a table.
By observing the gathered data in the table above, I noticed that the scatter graph showing the Key Stage 2 English results are affected more by the IQ, than the Maths and Science results.
The table also indicates through the R² value, that on average, around 74% of the Key Stage 2 results are affected by the IQ, which shows there is a strong relationship between the average Key Stage 2 results and the IQ.
Now I will only look at the Year 9 subset.
The following scatter graphs represent data from the Year 9 subset.
The scatter graph above shows Year 9 pupils’ IQ and average Key Stage 2 results. Their relationship is seen as a strong positive correlation, which indicates that the greater the IQ, the greater the average Key Stage 2 results. The R² value (0.9311) shows that 93% of the average Key Stage 2 results are affected by the IQ.
This scatter graph illustrates Year 9 pupils’ IQ and Key Stage 2 English results. A strong positive correlation is seen, which shows that the greater the IQ, the greater the Key Stage 2 English results. The R² value of 0.8522 indicates that 85% of the Key Stage 2 English results are affected by the IQ.
This scatter graph shows Year 9 pupils’ IQ and Key Stage 2 Maths results, it has a strong positive correlation and a R² value of 0.7305. The positive correlation shows that the greater the IQ, the greater the Key Stage 2 Maths results. The R² value shows that 73% of the Key Stage 2 Maths results are affected by the IQ.
The relationship of Year 9 pupils’ IQ and Key Stage 2 Science results are shown in the scatter graph above. A median positive correlation is shown, which indicates that the greater the IQ, the greater the Key Stage 2 Science results. The R² value (0.662) shows that 66% of the Key Stage 2 Science results are affected by the IQ.
All these scatter graphs support my hypothesis, that the greater the IQ, the greater the Key Stage 2 results. Consequently, this relationship results in a positive correlation which I had predicted to see if my hypothesis was true.
I have now placed the equations of the line of best fit and the R² values of these scatter graphs into a table.
By observing the gathered data in the table above, I noticed that the scatter graph showing the Key Stage 2 English results are affected more by the IQ, than the Maths and Science results.
The table also indicates through the R² value, that on average, around 93% of the Key Stage 2 results are affected by the IQ, which shows there is a very strong relationship between the average Key Stage 2 results and the IQ.
Now I will look at only the Year 10 subset.
The following scatter graphs represent data from the Year 10 subset.
This scatter graph shows Year 10 pupils’ IQ and average Key Stage 2 results. There is a strong positive correlation, which means the greater the IQ, the greater the average Key Stage 2 results. The R² value of 0.7848 suggests that 78% of the average Key Stage 2 results are affected by the IQ.
The scatter graph above shows Year 10 pupils’ IQ and Key Stage 2 English results, and has a strong positive correlation. This means the greater the IQ, the greater the Key Stage 2 English results. The trend line has a R² value of 0.8728 refers to how much the Key Stage 2 results are affected by the IQ, therefore in relation to the scatter graph above, it is around 87%.
This scatter graph shows the relationship between Year 10 pupils’ IQ and Key Stage 2 Maths results, which is seen as a weak positive correlation and tells us that the greater the IQ, the greater the Key Stage 2 Maths results. The R² value of 0.2793 indicates that 28% of the Key Stage 2 Maths results are affected by the IQ.
This scatter graph shows Year 10 pupils’ IQ and Key Stage 2 Science results. The median positive correlation illustrates that the greater the IQ, the greater the Key Stage 2 Science results. The R² value of the trend line is 0.6284, which suggests that 63% of the Key Stage 2 Science results are affected by the IQ.
These scatter graphs from the Year 10 subset support my hypothesis that the greater the IQ, the greater the Key Stage 2 results – resulting in a positive correlation.
I have now placed the equations of the line of best fit and the R² values of these scatter graphs into a table.
By observing the gathered data in the table above, I noticed that the scatter graph showing the Key Stage 2 English results are affected more by the IQ, than the Maths and Science results.
The table also indicates through the R² value, that on average, around 93% of the Key Stage 2 results are affected by the IQ, which shows there is a very strong relationship between the average Key Stage 2 results and the IQ.
Now I will look at only the Year 11 subset
The following scatter graphs represent data from the Year 11 subset.
The scatter graph above shows Year 11 pupils’ IQ and average Key Stage 2 results. The strong positive correlation tells us that the greater the IQ, the greater the average Key Stage 2 results. The R² value is 0.9711, which indicates that 97% of the average Key Stage 2 results are affected by the IQ.
This scatter graph shows a strong positive correlation in relation to Year 11 pupils’ IQ and Key Stage 2 English results. This means that as the IQ increases, the Key Stage 2 English results increase. This scatter graph has a R² value of 0.7221, which suggests that 72% of the Key Stage 2 English results are affected by the IQ.
The scatter graph above shows Year 11 pupils’ IQ and Key Stage 2 Maths results. It has a strong positive correlation which shows the greater the IQ, the greater the Key Stage 2 Maths results will be. The R² value of 0.8692 indicates that 87% of the Key Stage 2 Maths results are affected by the IQ.
This scatter graph showing the relationship between Year 11 pupils’ IQ and Key Stage 2 Science results, has a strong positive correlation and a R² value of 0.8692. The strong positive correlation is an indication that the Key Stage 2 Science results are dependent on level of IQ – the greater the IQ, the greater the Key Stage 2 Science results.
All the scatter graphs referring to the Year 11 subset support my hypothesis on how the two variables would affect one another and the resulting effect if the relationship between them, which I had predicted, was true. All the scatter graphs contain the same relationship – the greater the IQ, the greater the Key Stage 2 results, therefore, causing a positive correlation.
I have now placed the equations of the line of best fit and the R² values of these scatter graphs into a table.
By observing the gathered data in the table above, I noticed that the scatter graph showing the Key Stage 2 Maths and Science results are affected more by the IQ, than the English results.
The table also indicates through the R² value, that on average, around 97% of the Key Stage 2 results are affected by the IQ, which shows there is a very strong relationship between the average Key Stage 2 results and the IQ.
Mean, Mode, Median, Maximum, Minimum, and Range
Now I will compare the mean, mode, median, maximum, minimum, and range of the IQ, Key Stage 2 results, and the average Key Stage 2 results, for my stratified samples, male, female, year 7 and year 11 subsets. I have placed this data into three separate tables for sample, male and female. I have decided to use the year subsets 7 and 11 to compare the results I found in two different Key Stage groups.
Sample
Male
Female
Year 7
Year 11
From the mean data of this is information I can make the observation that the males have a higher IQ than the females. The reason being, the mean (average) IQ for a male is 104.08 and the mean IQ for a female is 103.68.
The mean data of the average Key Stage 2 results for males (4.29) and females (4.21) shows that the males had higher Key Stage 2 results. In addition, all three measures of average (mean, median and mode) are greater for males than for females, and the range of IQ and Key Stage 2 results is also greater for males than for females. In conclusion, the evidence suggests that, in general, males have a greater IQ and greater Key Stage 2 results.
These observations support my hypothesis, as the males had a higher IQ than the females, and they had higher Key Stage 2 results.
Minimum, Lower Quartile, Median, Upper Quartile and Maximum
Now I have found the minimum, lower quartile, median, upper quartile, and maximum data for the IQ, Key Stage 2 results, and average Key Stage 2 results and have put it into five separate tables for my stratified samples, male, female, Year 7 and 11 subsets.
Sample
Male
Female
The interquartile range for the male IQ is 5, but the female IQ is 7, which shows that female IQ is more spread out.
Year 7
Year 11
Now I will use this data to create box and whisker diagrams for each table, showing the minimum and maximum values, the median, and the upper and lower quartiles. I will be using box and whisker diagrams because they provide a very clear comparison between data sets and are useful for comparing distributions.
Box and Whisker Diagrams for IQ
The box and whisker diagrams show that the boys’ interquartile range is 2 IQ levels less than the girls. This suggests that the girls’ IQ were more spread out than the boys.
The box and whisker diagrams representing the Year 7 and 11 subsets, illustrates a clear comparison of pupils’ IQ in different Key Stage groups. The Year 11 median is closer to its lower quartile, in relation to the Year 7’s median and its lower quartile.
The Year 7 interquartile range is 6, which is greater than the Year 11 interquartile range of 4.75, which implies that the Year 7 pupils’ IQ is more spread out.
Now I will create box and whisker diagrams for average Key Stage 2 results, showing the minimum and maximum values, the median, and the upper and lower quartiles.
Box and Whisker Diagrams for Average Key Stage 2 Results
The box and whisker diagrams show that the boys’ interquartile range is equivalent to the girls’. This suggests that their average Key Stage 2 results are equally spread out.
The box and whisker diagrams representing the Year 7 subset, has a greater interquartile range than that of the 11 subset by 0.17 levels, which indicates that the Year 7 pupils’ average Key Stage 2 results are more spread out.
Below I have found the percentiles of pupils’ IQ and Key Stage 2 results for the sample data, the male, female, Year 7 and 11 subsets.
Sample
Male
Female
Year 7
Year 11
A clear observation that is frequent throughout all these tables is that the IQ and Key Stage 2 results become less spread out around the 50th percentile (the median) but are more spread out at the lowest and highest percentiles.
Now I will again use stratified samples to make a population of 30 from the population of 1183 shown below from the Mayfield High School. I will then compare the data from this, to the stratified samples with a population of 60.
To get the proportion of any year you would have to do the following:
(Total for Chosen Proportion) ÷ (Overall Total) x (Sample Size)
The answer obtained tells you how many you would need to choose from your chosen proportion, and to choose this you would:
(Total for Chosen Proportion) ÷ Answer
Then the answer obtained from this calculation will tell what values you will need to use.
So because my population is going to be 30 then to get the proportion of Year 7 boys I will do the following:
151 ÷ 1183 x 30 = 3.829 = 4
Therefore, I will need to choose 8 Year 7 boys and to choose this I will do the following:
151 ÷ 4 = 37.75 = 38
This means I will use every 38th Year 7 boy for my sample. So I will choose the 38th, 76th, 114th, 152nd, 190th, 228th, 266th boy.
Here are these stratified samples with a population of 30.
The following scatter graphs represent data within the stratified samples of a population of 30.
This scatter graph shows pupils’ IQ and average Key Stage 2 results. It shows a strong positive correlation which therefore means that the greater the IQ, the greater the average Key Stage 2 results are. The R² value of the trend line relates to the how the average Key Stage 2 results are effected by the IQ. Here we see that the R² value is 0.8552 which shows that 85% of the average Key Stage 2 results are affected by the IQ.
This scatter graph showing pupils’ IQ and Key Stage 2 English results shows a strong positive correlation, which describes the relationship between the IQ and English results – the greater the IQ, the greater the Key Stage 2 English results. The R² of this graph is 0.7439 which illustrates that 74% of the English results are affected by the IQ.
This scatter graph shows pupils’ IQ and Key Stage 2 Maths results. Above we see a median positive correlation, which is evident through the R² value – 0.6651. This tells us that 67% of the Maths results are affected by the IQ.
The scatter graph above shows pupils’ IQ and Key Stage 2 Science results, it has a median positive correlation, shown by the R² value which is 0.5915. This means that 59% of the Key Stage 2 Science results are affected by the IQ.
All these graphs support my hypothesis that the greater the IQ, the greater the Key Stage 2 results are – this is made clear through the positive correlation in the scatter graphs – which I had predicted.
I have now placed the equations of the line of best fit and the R² values of these scatter graphs into a table.
By observing the gathered data in the table above, I noticed that the scatter graph showing the Key Stage 2 English results are affected more by the IQ, than the Maths and Science results.
The table also indicates through the R², that on average, around 86% of the Key Stage 2 results are affected by the IQ, which shows there is a very strong relationship between the average Key Stage 2 results and the IQ.
Now I will compare these R² values with those from the stratified samples with a population of 60.
Stratified Samples: With a Population of 60
Stratified Samples: With a Population of 30
By looking at the R² values from both populations, I noticed that both their Key Stage 2 English results have a higher R² value than their Maths and Science results. This implies that the IQ and English results have the strongest relationship; the Key Stage 2 English results are affected the most by the IQ.
However, the population of 60 has a R² value of 0.6982 for the average Key Stage 2 results, but the average Key Stage 2 results from the population of 30 has a R² value of 0.8552. This suggests, on average, that 86% of the Key Stage 2 results are affected by the IQ from the population of 30, but only 70% is affected from the population of 60, which shows that the population of 30 has Key Stage 2 results which have a greater relationship with the IQ. However, this difference could be due to the fact that the population of 30 has half the amount of Key Stage 2 samples, than the population of 60.
Conclusion
This investigation of Mayfield High School supports my hypothesis that ‘the greater the IQ, the greater the Key Stage 2 results’, which is evident through the positive correlation which runs frequent through the entire investigation in every scatter graph.
The population of 60 had Key Stage 2 results with a weaker relationship to IQ, than the population of 30. This difference could be down to the fact that the population of 60 is spread out amongst a greater amount of Key Stage 2 results. Therefore, the results from the population of 60 are likely to be more accurate.
Investigating Further
Now I will question the accuracy of the linear equations, by comparing it with quadratic equations.
I will investigate this through the average Key Stage 2 results and IQ in the sample data from the population of 60.
Here the linear equation is: y = 0.0538x – 1.3341, with y representing the average Key Stage 2 results and x representing the IQ.
If the IQ is 112, then the average Key Stage 2 result would be:
Y = 0.0538x – 1.3341
Y = (0.0538 x 112) – 1.3341
Y = 6.0256 – 1.3341
Y = 4.6915
However, when the IQ is 112 the actual average Key Stage 2 result is 5; the linear equation provided an answer which was 0.3085 less. Therefore, this shows the linear equation: Y = 0.0538x – 1.3341 is quite accurate.
Now I will change the linear equation into a quadratic equation by changing the linear trend line to a polynomial trend line with an order of 2.
The quadratic equation it is:
Y = -0.0003x² + 0.1134x – 4.4287
If the IQ is 112, then the average Key Stage 2 result would be:
Y = -0.0003x² + 0.1134x – 4.4287
Y = (-0.0003 x 112²) + (0.1134 x 112) – 4.4287
Y = -3.7632 + 12.7008 – 4.4287
Y = 4.5089
However, when the IQ is 112 the actual average Key Stage 2 result is 5; the quadratic equation provided an answer which was 0.4911 less. Therefore, this shows the quadratic equation: Y = -0.0003x² + 0.1134x – 4.4287 is not as accurate as the linear equation.
Now I will investigate the reliability of these results by comparing another linear equation with a quadratic equation, but this time I will use the Key Stage 2 English results and IQ in the sample data from the population of 60.
Here the linear equation is: y = 0.0571x – 1.7348, with y representing the Key Stage 2 English results and x representing the IQ.
If the IQ is 112, then the average Key Stage 2 result would be:
Y = 0.0571x – 1.7348
Y = (0.0571 x 112) – 1.7348
Y = 6.3952 – 1.7348
Y = 4.6604
However, when the IQ is 112 the actual average Key Stage 2 result is 5; the linear equation provided an answer which was 0.3396 less. Therefore, this shows the linear equation: Y = 0.0571x – 1.7348 is quite accurate.
Now I will change the linear equation into a quadratic equation by changing the linear trend line to a polynomial trend line with an order of 2.
The quadratic equation it is:
Y = 0.0015x² - 0.2564x + 14.533
If the IQ is 112, then the average Key Stage 2 result would be:
Y = 0.0015x² - 0.2564x + 14.533
Y = (0.0015 x 112²) - (0.2564 x 112) + 14.533
Y = 18.816 - 28.7168 + 14.533
Y = 4.6322
However, when the IQ is 112 the actual average Key Stage 2 result is 5; the quadratic equation provided an answer which was 0.3678 less. Therefore, this shows the quadratic equation: Y = 0.0015x² - 0.2564x + 14.533 is accurate but not as accurate as the linear equation.
Conclusion:
There is a positive correlation between the IQ and KS2 result both across the school as a whole and within each year group. This correlation appears to be stronger when individual year groups and separate genders are considered.