Differences between protected and unprotected beaches
Looking at the transect for the protected beach at the open groyne (see fig 3:1), it is clear that the beach is well built up and has a fairly steep incline for a beach. The first section is an incline of 15.5º, the second of 9.5º and the final section is 7.5º; the average angle is approximately 10.8º. The sediment is mostly fine but there are areas of pebbles toward the back of the beach and also near the middle of the second section; indicating berms.
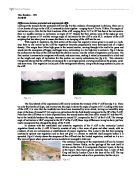
Fig 4:5 is a photograph showing the open groyne. The difference in height of the beach either side is clearly considerable, and the nature of the sediment is mostly fine with some pebbles. Some of the riprap can be seen in the bottom left corner. Notable also is the difference in how far the sea has come in for the different sides of the groyne. On the protected (right) side the sea is still quite a way out but for the unprotected (left) side it has come in to about half the length of the groyne.
Looking at the transect for the U beach (see fig 3:3) the difference in shape is immediately obvious. It is much less steep, the first angle being 5º as opposed to 15.5º at the open groyne, then 4º, then 9º and finally 8º; the average angle is 6.5º as opposed to 10.8º for the open groyne. The sediment size is much larger and with a larger distribution, and there are three berms of larger clay rocks and shingle, one in the second section as a high tide mark, one in the third as a storm tide mark and one at the base of the cliff.
Fig 4:6 is a photograph showing the U beach, notable features are its shallowness and the distribution of larger pieces of sediment and shingle, though in this picture the berms are not clear.
The beach at the open groyne is so much steeper because the southeasterly wind had been
dominant and so LSD had been pushing the sediment along the beach toward the north. As the P beach has the open groyne the sand is able to accumulate by the side of it as the LSD pushes it into it. This view is supported by the graph showing depths of sand below the sea wall (see fig 3:8). This clearly shows an accumulation of sand at the souths of the last five groynes and depletions of sand on the norths. So this makes the P beach at the open groyne steep due to accumulation, and because there are no more groynes on the U beach the sand is not able to accumulate anywhere, so it is just transported away to the north by LSD, thus making the U beach shallow.
The sediment on the U beach is so large because it is the fallen debris from the cliff itself, which may be part of a slump that recently occurred or may be the product of physical weathering by constant wetting / drying at the sub-aerial interface. It consists of large lumps of clay and other large pieces of sediment, and because it has not been transported very far the wave energy has not had the chance to erode it by attrition to any real extent. (Fig 4:7 is an example of the fallen debris). In contrast, the sediment on the P beach is much finer as it is not made up of fallen debris as its part of the cliff no longer collapses. Moreover it is simply made up of sediment that has been transported along an entire stretch of P beach by the recent SE wind, and so it has had the chance to be broken down by the wave energy by attrition, and also is “topped up” with more fine sediment to help the management scheme.
Berms appear most obviously on the U beach, as the sediment is so much larger, with bands of larger sediment set in amongst areas of predominantly fine sediment. They are created by constructive waves that have sufficient energy to push larger sediment up the beach and mark the furthest point that the waves reached, so either a high tide mark or a storm tide mark. The sediment behind the band is subsequently washed away by other waves, leaving the berm behind. The presence of a berm right at the base of the U cliff suggested that the waves could at some point reach the base of the cliff, and had obviously been able to undercut it by hydraulic action and abrasion as the toes were truncated.
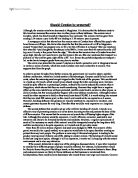
It is clear to see that management here has had a great affect on coastal processes. The groynes on the P beach stop sand from being transported away by LSD so that the sand can dissipate wave energy as it causes friction with it. This is clear to see in fig 4:5 in which the waves on the P beach are much further back than those on the U beach due to the fact that the accumulated sand on the P beach dissipates the waves energy. Also, because of the fact that the groynes stop sediment from being transported onto the U beach it may well have led to accelerated erosion of the U cliff. This is apparent when looking at the two from beaches from above. (See fig 4:8). The retreat of the U cliff has accelerated at such an alarming rate that riprap had to be put in place to protect the newly defenceless part of the P cliff where it joins the U cliff; it is protected by it from undercutting from hydraulic action and abrasion by the wave energy.
The transects are valid tools used to compare the P and U beach in that they clearly show the shapes of the beaches from a profile view and so clearly show the effect of management on the process of LSD in the distribution of sediment. The method used to obtain the angles and distances for the transects is reliable in that mathematical tools were used to obtain them, namely the clinometer and the tape measure. These give definite answers that must be correct, and so theoretical repeats if carried out in the same space of time would generate the same answers. Accuracy is fairly high for the transects in that the margin of area for the clinometer was only 0.5º, however it may have been affected by strong winds on the beach which would have blown the dial slightly past the true value of inclination, lowering the accuracy. To improve the accuracy of the transect several repeats could be carried out for the measurement of the angle of inclination for each break of slope, and a more accurate clinometer could be used with a lower degree of error.
Differences between north and south of the protected beach
When comparing the transect for the north of the P beach at the open groyne (see fig 3:1) and the transect for the south of the P beach at the closed groyne (see fig 3:2) the differences are considerable. The closed groyne part of the beach is much shallower, its first angle is 5.5º as opposed to 15.5º for the open groyne, then 9º and finally 5º; its average angle being 6.5º (the same as the U beach) as opposed to 10.83º for the open groyne.
The difference in shape of the two transects must be due to the fact that the process of LSD is affecting them in different ways. The extensive accumulation of sand at the open groyne would certainly suggest that LSD was transporting the sediment towards the north of the beach and that subsequently the southeasterly wind had been dominant. The graph showing depths of sand beneath the sea wall (see fig 3:8) supports this theory very strongly in that there is for the most part extensive accumulation of sand on the souths of each groyne, showing the LSD had transported the sediment along the beach toward the north. Indeed the average depth of beach below the sea wall for the norths was 185.7 cm and for the south’s it was 103.9cm, which shows that on average the northern sides of the groynes were lower down because of the depletion of sand. This would explain therefore why it is that the beach at the closed groyne resembles that of the U beach through having a very shallow incline, in that sediment had been moved toward the north and had not accumulated at the closed groyne like it had at the open groyne. Fig 4:9 is a photograph showing accumulation of sediment on the southern side of one of the groynes.
However, the graph does throw up two anomalous depths: the depth of the beach below the wall at the closed groyne is zero and at the south of groyne six it’s 15, so an northern side is larger than its corresponding southern side by 15cm. Similarly, the northern side of groyne six is 60cm below the wall but the southern side of groyne five is 130cm below the wall. In both these cases the northern side is higher than its southern counterpart, and this would suggest that LSD had previously been in the direction toward the south by a NE wind to cause accumulation on the northern sides of the groynes. This would mean that the beach at the closed groyne is shallow because sediment had been moved away from it towards the north by the temporarily dominant SE wind, though as it is in the shadow of the closed groyne the effect of the LSD is weaker upon it and so it still retains the shape to some extent of beach which has been affected by LSD caused by a NE dominant wind.
Fig 4:11 is a diagram explaining LSD.
Looking at the scattergraph for the depths of sand below the sea wall for the souths of each groyne (see fig 3:6) there is a fairly strong negative correlation with a Spearman’s rank of –0.64. Similarly with the scattergraph for the norths of each groyne (see fig 3:7) the same relationship is found with the same Spearman’s rank of –0.64. These graphs suggest that the predominant wind is the NE wind as they show more sediment toward the south. This then suggests the shape of the beach is only short term and that the SE wind must have recently had more energy than usual – as the SE wind has a much shorter fetch it would be expected to be much weaker than the NE wind with a much larger fetch.
Looking at both of the graphs showing the mass of each sediment type at the north and south of the P beach (see figs 3:10 and 3:11) as well as the cumulative frequency graph which compares them (see fig 3:9) the composition of the sediment at the closed groyne is predominantly coarse with finer sediment making up the minority: 135g of 8mm, 125g of the 2mm and the remaining 40g being 0.5mm or less. The graph shows a positively skewed distribution. In contrast, the composition of sediment at the open groyne is much more of a normal distribution: 8mm has only 17g as opposed to 135g at the closed groyne, 2mm has 104g which is still less than the 125g of the closed groyne and its majority is made up of 0.5mm sediment with 111g. The remaining two categories constitute 68g as opposed to the 22g for the last two at the closed groyne.
These graphs would certainly suggest that as one moves toward the north of the beach the sediment becomes less coarse, but conclusions are made very difficult here because of the sample frame used. As only two sets of stratified points were sampled, one at each end of the P beach, it gives no clear picture of what is happening with the nature of sediment at the intermediate groynes. Because of this, it is hard to determine the nature of sediment in general across the whole beach. A clear indication of this discrepancy is fig 4:9; this shows an area of practically all pebbles at the back of the beach next to one of the intermediary groynes in the north end and then on the other side the nature of sediment is fine. This is an indication that the nature of sediment is perhaps in a pattern for each pair of groynes, going from fine in the south to coarse in the north. This theory is supported by the graphs showing depth below sea wall (see fig 3:8) in that it agrees with the view that LSD is transporting sediment in a northern direction, and so when the waves have sufficient energy they will transport the large sediment and then deposit it on the southern side of the groyne it is transported to. Going back to the scattergraphs, these both gave a Spearman’s rank of -0.64, which suggested that the dominant wind was the NE. This would mean that larger sediment would have previously been found at the south, though the temporary surge in SE wind means it is found in the north. The sediment at the south is much coarser as it is in the shadow of the closed groyne – like with the sand, the larger sediment has not yet been moved away from the north of the closed groyne. Along the beach, there was extensive build up of coarser sediment on the S’s of the intermediate groynes due to the SE wind, though not at the open groyne itself. This may be because the progress of the larger sediment has been impeded by the intermediate groynes. The long term process is that sediment is undercut from the U cliff and transported by NE wind through the open groyne to nourish the beach. In the short term, coarse material has been brought back by the SE wind.
Looking at the pie charts for the composition of sediment (see fig 3:12) one is able to directly contrast corresponding sites from the open and closed groyne. Obviously the nature of sediment at different points is dependant on the amount of wave energy that the previous tides have had. Site 1 is at the back of the open groyne beach; it is made up of predominantly 0.5mm sediment with 51g and 2mm sediment with 34g (100g are taken from each point), whereas site 4 at the closed groyne has mainly 8mm sediment with 51g and 32g of 2mm sediment. This agrees with what was stated in the previous paragraph in that the nature of sediment at the southern side of the beach is coarser as it is protected by the closed groyne from SE wind driven LSD. The next corresponding sites all show very similar things with the southern side having coarser sediment. At site 2 it has more of the very fine sediment with less 0.5mm, and at site 3 three there is a minor increase in 2mm sediment. Site 5 is similar to site 4 except there is more of the 2mm and the 0.125 and residue have both become very small. Site 6 is the very similar to site 4 but 8mm sediment is slightly less. The differences in sediment composition occur at the corresponding sites because different tides would have had different wave energies and so may have been able to move larger sediment further forward or not move it very far at all, plus they will have come up to different areas of the beach meaning berms could be created marking the furthest point that they reached. Theses would be areas of large sediment among areas of predominantly fine sediment, occurring at different stages on the beach. The pie charts highlight the minor differences that occur in the distribution of sediment along stretches of beach due to the varying strength of wave energy and the extent of the previous tides.
2
Chi can be used to indicate the relevance of comparing the corresponding sites:
Null hypothesis: no significant difference between sites 1 and 4, 2 and 5, 3 and 6.
Alternative hypothesis: there is significant difference.
Critical value exceeded, reject null hypothesis.
We can say at 99.9% confidence level management serves to sort sediment.
The effect of management on the process of LSD with the transportation and deposition of sediment is obviously quite considerable. The groynes are the reason behind the shape of the beach in that LSD transports sand along it and is forced to deposit it at the groynes leading to accumulation on one side and then depletion on the other. As the groynes keeps the sand on the beach the sand is able to dissipate the wave energy and so subsequently protect the wall from damage it might take from the wave energy which would otherwise erode it by hydraulic action and abrasion. It affects the distribution of sediment, with the temporarily dominant SE wind stronger than the NE wind larger sediment can build up against the groynes on the southern sides, leaving finer sediment on the northern sides.
The validity, reliability and accuracy for the transect of the south of the P beach is obviously the same for the north of the P beach.
The graph showing the depth of the beach below the sea wall for both sides of the groynes is valid for the investigation in that it clearly shows the extent of accumulation and depletion of sand on the specific sides of the groynes, showing the effect that management has on the process of LSD in determining the shape of the P beach. The method used is reliable in that a tape measure was used to give definite numerical results which were plotted on the graph, so theoretical repeats in the same space of time would be the same. Accuracy is very high with measurements to the nearest mm. To improve the results in general so as to give a clearer picture it would be necessary to measure the depth of beach below the sea wall at more points along the beach instead of just 10m to the north and south of the groynes. This would show any major discrepancies in the distribution of sand on the beach.
The scattergraphs showing the depth of beach below sea wall for the north’s and south’s of each groyne separately are valid in that they show how the level of sediment in general decreases toward the north of the beach, showing the LSD is transporting sand toward the north as a temporary process due to the recent unusual strength of the SE wind. The method used was obviously the same for the norths and souths simultaneously and so is both reliable and accurate. The accuracy of the Spearman’s Rank calculations could be improved by including more depths along the beach instead of just the seven used for both the north’s and south’s, indeed ten is the suggested minimal number of points to include in the calculation to generate an accurate answer.
The graphs showing the mass of each sediment size for the north and south of the P beach as well as the scattergraph that plots them simultaneously are valid in that they show and allow comparison of the sediment composition at the north and south of the P beach, highlighting the effect of management on the distribution of different sizes of sediment. Also the same can be said for the pie charts showing the distribution of the different sizes of sediment at corresponding sites at the north and south of the P beach. The results are reliable as they were found using a sediment sieve that separated the sediment into the different sizes allowing each of their masses to be measured, thus giving definite mathematical results i.e. theoretical repeats at the exact same location in the exact same space of time would provide exactly the same results. To improve the clarity of the results the sample frame could be massively enlarged. As with the depths of below the sea wall, sites 10m to the north and south of each groyne could be sampled and this would give a clearer picture as to what is happening to the general size of sediment between each pair of groynes as opposed to being limited to solely points at the north and south. Also, to further the investigation into LSD, it could be measured using tracers and a timer, judging its strength and direction by how far it can move the traced object within a period of time. The investigation could be carried out over several days to see how the beach changes in the short term. Also the long-term differences could be measured perhaps over a period of six months. This would highlight when the dominant wind changes.
In conclusion, the P cliff has a much shallower incline than the U cliff as it has been sculpted as part of the management scheme. This affects the coastal process of slumping in that the cliff is unable to slump due to the fact that none its incline is over the angle of rest at 35º. Vegetation, which is able to prosper due to the lack of slumping, and drainage on the cliff helps to prevent saturation of the cliff which would make it heavy and so more likely to slump. They do this by making sure as little water as possible is able to reach or stay in the ground – vegetation can intercept it and remove it from the soil by evapotranspiration, and the drainage system can collect it from the surface and transport it into the sea. Also, vegetation as part of the management can combat weathering in that its roots hold the soil together.
The P beach has a steeper incline at the closed groyne than the U beach due to the presence of the groynes as part of the management scheme; they prevent sand from being transported away from the P beach by LSD. Sand is used to dissipate wave energy so that it has as little erosive effect on the sea wall (protecting the base of the P cliff) as possible. The management affects the distribution of sand due to LSD in that sand accumulates on the southern side of the open groyne as the SE wind has been dominant and so LSD is transporting it in a northern direction and pushes it into it, forcing the sand to accumulate as it can not easily pass through the groyne, making the incline of the P beach much steeper. The lack of groynes on the U beach means that the sand cannot accumulate anywhere and so the incline is shallow.
Finally, the north of the beach is steeper due to the accumulation of sand at the open groyne as LSD pushes it into it, and the south of the P beach is shallower as sediment is being moved away from it by LSD. The management affects the distribution of sediment in that it dictates the shape of the beach due to the accumulation and depletion of sand on the different sides of the groynes. The overall amount of sediment decreases as you go toward the north as the dominant wind is NE it pushes sediment toward the south. The sediment is larger on the south of the intermediate groynes as the temporary LSD has the strength to move it against them, though this is not shown at the open groyne as the progress of the larger sediment must have been halted by the intermediate groynes.
The aim of this enquiry was to investigate whether management affects coastal processes, and from this analysis of the data collected it is clear to see that it does. The effects must be seen as positive because they prevent the tourist area of Walton-on-the-Naze from slumping into the sea, this would be disastrous as the livelihoods of thousands of residents would disappear too. Not only at Walton are these effects of management positive but all around the country, various coastal industries, power stations and other tourist and residential areas are all protected by similar management schemes and so the management must be a good thing if it saves these from destruction and so saves employment and the houses of coastal residents. However, another attitude to be taken into account are the unprotected coastal landowners who lose fertile farmland to an increasing extent due to accelerated erosion caused directly by the management. Looking at Walton, riprap has had to be put in to protect the side of the P cliff, which was exposed to wave attack as the adjacent U cliff retreated at an unexpectedly accelerated rate. A similar example of this is at Mappleton where management of the town’s cliffs led to accelerated erosion of fertile farmland a short way down the coast. I feel that it will be necessary for some steps to be taken to protect the unprotected farmland as this too is part of peoples’ livelihoods, the saving of which was the intention of the management in the first place. Also the existing management could perhaps be modernised, making use of newer, greener types instead of hard engineering like the concrete sea walls that look unattractive and unnatural. The walls used are now emerging to be less efficient as first expected in that they absorb the waves energy due to the flat shape which causes damage, newer types of wall are curved and so can reflect the waves energy away, saving the damage and so meaning the wall does not have to be repaired as often as its more basic counterpart.