Sheringham has an ideal example of what the coastline directly behind the sea is like both protected and unprotected, which contrast well.
IN PLACES WHERE THERE IS GREATER USE OF COASTAL PROTECTION, THE LAND BEHIND IT CAN BE USED TO GREATER EXTENT THAN THE LAND THAT IS PARTIALLY OR NOT PROTECTED AT ALL
Contents Page
Page Number
Content
Introduction
3
Method
4
Method - Pebble Sampling
5
Method - Clinometre
6
Method - Dumpy Level
7
Method - Wave Characteristics
8
Method - Transect Strip Map
9
Method - Different Types Of Coastal Protection
0
Method - Urban Work
1
Results - Wave Characteristics
2
Results - Pebble Sampling
4
Results - Transect Strip Map
5
Results - Clinometre
6
Results - Dump Level
7
Results - Tourist Facilities Count
8
Results - Questionnaire
20
Results - Traffic Survey
21
Results - Pedestrian Count
22
Conclusion
23
Evaluation
24
Glossary
25
Bibliography
25
Acknowledgments
26
Graph - Beach Profile (Dumpy Level)
27
Diagram - Calibrated Callipers
28
Diagram - Clinometre
29
Diagram - Dumpy Level
30
Diagram - Waterproof Tape
31
Diagram - Waves
32
Diagram - Long shore drift
33
Field sketch Looking East
34
Field sketch Looking West
35
Field sketch Of Groyne
Introduction
I went to Sheringham on the 17th of July 2002 to carry out the fieldwork for my geography coursework.
I went to Sheringham, which is situated, on the north Norfolk coast. The grid reference is 160436.
We went to Sheringham for various reasons and chose it over other places around the area. The main reason was because Sheringham has an ideal example of what the coastline directly behind the sea is like both protected and unprotected, which contrast well. Also it is an ideal distance from where we are based to where we have to travel in a day.
My hypothesis is:
IN PLACES WHERE THERE IS GREATER USE OF COASTAL PROTECTION, THE LAND BEHIND IT CAN BE USED TO GREATER EXTENT THAN THE LAND THAT IS PARTIALLY OR NOT PROTECTED AT ALL
This means that where coastal protection is used more widely and to more effect, there can be more extensive use of the land that is behind it where as land that is protected by the coastal protection or not very well they cant use the land behind it so extensively.
While I was at Sheringham I completed the aims that I had set. These aims were:
* To examine the cliffs behind the beach to see how erosion from the sea has affected them,
* To compare how the different types of coastal defences such as Rock armour and Sea walls are used.
* To look at and survey the quality of the beach.
* To evaluate the coastal scenery.
* To make a profile of the beach.
* To look at and investigate the action of the sea and find out how it is working in Sheringham.
* To investigate how parts of the coastline have been looked after well and also how it has been mistreated.
* To investigate the impact that tourism has affected and had an impact to the coastline.
While at Sheringham we did a beach angle survey, pebble sampling and wave characteristics on the unprotected side. We also did a questionnaire on the High street and a tourist facilities count 200paces east and west of the promenade.
Method
We carried out all measuring tasks on the western side of the lifeboat house because it has not been protected by sea defences. Because on the western side there has been no sea defences the erosion and weathering that has taken place around the area is all natural.
When we found out the tasks that we needed to have done we separated and handed out each task between the groups. This meant around two or three people were doing each task. We split the tasks up because we did not have the time available to us, to allow us to do each task for ourselves.
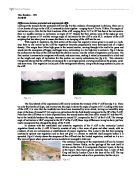
After all tasks had been done everybody individually drew a field sketch of the cliff face looking west down the beach. We did this so we could see how different types of weathering and erosion had affected it. The field sketch can be found on page 33.
Weathering could be noticed on the upper sections of the cliff where freeze thaw action has been present. This is where water freezes in cracks in the rocks and while it freezes it expands putting the rock under pressure and eventually cracking it.
A lot of evidence of erosion was present with corrasion and hydraulic action being most present. Corrasion occurs from the rocks and stones and other load being hurled against the cliff, where as hydraulic action is the waves causing the cliff to break and then the top of the cliff to slump.
Method - Pebble Sampling
A waterproof tape was spread from the base of the cliff to the sea; this gave us a profile that we could work along.
As you tracked down the profile at 7m intervals measure ten stones selected at random in each dimension and record the data collected on a chat. Also recorded was the shape of the rock.
The different shapes of rock are
We measured the angles and the size to see at which place on the beach they were worn down most.
Contents Page
Page Number
Content
Introduction
3
Method
4
Method - Pebble Sampling
5
Method - Clinometre
6
Method - Dumpy Level
7
Method - Wave Characteristics
8
Method - Transect Strip Map
9
Method - Different Types Of Coastal Protection
0
Method - Urban Work
1
Results - Wave Characteristics
2
Results - Pebble Sampling
4
Results - Transect Strip Map
5
Results - Clinometre
6
Results - Dump Level
7
Results - Tourist Facilities Count
8
Results - Questionnaire
20
Results - Traffic Survey
21
Results - Pedestrian Count
22
Conclusion
23
Evaluation
24
Glossary
25
Bibliography
25
Acknowledgments
26
Graph - Beach Profile (Dumpy Level)
27
Diagram - Calibrated Callipers
28
Diagram - Clinometre
29
Diagram - Dumpy Level
30
Diagram - Waterproof Tape
31
Diagram - Waves
32
Diagram - Long shore drift
33
Field sketch Looking East
34
Field sketch Looking West
35
Field sketch Of Groyne
Introduction
I went to Sheringham on the 17th of July 2002 to carry out the fieldwork for my geography coursework.
I went to Sheringham, which is situated, on the north Norfolk coast. The grid reference is 160436.
We went to Sheringham for various reasons and chose it over other places around the area. The main reason was because Sheringham has an ideal example of what the coastline directly behind the sea is like both protected and unprotected, which contrast well. Also it is an ideal distance from where we are based to where we have to travel in a day.
My hypothesis is:
IN PLACES WHERE THERE IS GREATER USE OF COASTAL PROTECTION, THE LAND BEHIND IT CAN BE USED TO GREATER EXTENT THAN THE LAND THAT IS PARTIALLY OR NOT PROTECTED AT ALL
This means that where coastal protection is used more widely and to more effect, there can be more extensive use of the land that is behind it where as land that is protected by the coastal protection or not very well they cant use the land behind it so extensively.
While I was at Sheringham I completed the aims that I had set. These aims were:
* To examine the cliffs behind the beach to see how erosion from the sea has affected them,
* To compare how the different types of coastal defences such as Rock armour and Sea walls are used.
* To look at and survey the quality of the beach.
* To evaluate the coastal scenery.
* To make a profile of the beach.
* To look at and investigate the action of the sea and find out how it is working in Sheringham.
* To investigate how parts of the coastline have been looked after well and also how it has been mistreated.
* To investigate the impact that tourism has affected and had an impact to the coastline.
While at Sheringham we did a beach angle survey, pebble sampling and wave characteristics on the unprotected side. We also did a questionnaire on the High street and a tourist facilities count 200paces east and west of the promenade.
Method
We carried out all measuring tasks on the western side of the lifeboat house because it has not been protected by sea defences. Because on the western side there has been no sea defences the erosion and weathering that has taken place around the area is all natural.
When we found out the tasks that we needed to have done we separated and handed out each task between the groups. This meant around two or three people were doing each task. We split the tasks up because we did not have the time available to us, to allow us to do each task for ourselves.
After all tasks had been done everybody individually drew a field sketch of the cliff face looking west down the beach. We did this so we could see how different types of weathering and erosion had affected it. The field sketch can be found on page 33.
Weathering could be noticed on the upper sections of the cliff where freeze thaw action has been present. This is where water freezes in cracks in the rocks and while it freezes it expands putting the rock under pressure and eventually cracking it.
A lot of evidence of erosion was present with corrasion and hydraulic action being most present. Corrasion occurs from the rocks and stones and other load being hurled against the cliff, where as hydraulic action is the waves causing the cliff to break and then the top of the cliff to slump.
Method - Pebble Sampling
A waterproof tape was spread from the base of the cliff to the sea; this gave us a profile that we could work along.
As you tracked down the profile at 7m intervals measure ten stones selected at random in each dimension and record the data collected on a chat. Also recorded was the shape of the rock.
The different shapes of rock are
We measured the angles and the size to see at which place on the beach they were worn down most.