I looked for information from the Internet about past fieldtrips to the area and whether any other scientist had drawn up some conclusions regarding the lack of visible Carboniferous Limestone in Somerset. There is a lot of additional information collected from a past fieldtrip to Blue Anchor. Here is a map showing the lack of Carboniferous Limestone in Somerset but there is some visible in Devon, Wales and in the Mendip area.
The light blue in colour shows where the limestone is. The large area of limestone present in the B&NES (Bath and North-East Somerset), Gloucestershire, South Devon and some in Wales (although this is not visible in this map).
Planning
Desktop Investigation
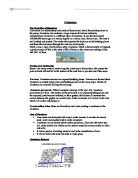
In this investigation, I will be trying to prove or disprove the possibilities about where the Limestone has gone. This will be done in the following ways to try to find the correct:
* The depositional records for before and after the carboniferous period. The Devonian and the Permian Rocks around this area showed that the periods were the same as in common with the rest of the country. Therefore, we can assume that the carboniferous was the same as well.
* Looking for evidence to support that the limestone has been eroded away, you have to look for Limestone pebbles on the beaches in the area to check for erosion and then deposition at the sea. There may also be some calcium carbonate in the mudstone and the content can be found by an experiment (see later on).
* Looking for evidence of the dip of the limestone visible to see if there is an anticline. This is to see if the limestone is underneath the Rock that is on top of now possibly.
* Check for large scale folding and faulting that is visible. This is to see if the Limestone is below the Rock in a syncline or the faulting may mean that there was Earthquake in the near past.
* Check lower and upper layers of Rock for deposition of sediments. This is to see if the Limestone has been overlaid by other Rock.
* To see if the Limestone has been all quarried away; I will be looking at the old quarrying records and visible signs of quarrying eg. Big holes in the ground.
Methods of Analysis
Comparing the fossils found with known outcrops of Carboniferous Limestone, it will be possible to give a small idea about what has happened to the Carboniferous Limestone. The fossils will show if the environment was right for the deposition of the limestone in the Carboniferous period. Using the findings of the desktop investigation that will be carried out with information coming from the Internet, books and maps of the local area, I will be looking for evidence that the Carboniferous Limestone existed at all and that if the Limestone was deposited then where has it gone. Using the results of the fieldwork and the lab work, I will be able to see if the Limestone has been eroded and can be found in the pebbles on the beach. The fieldwork will also look at the fault to see if there is a possibility that the fault has sufficient downthrow to completely hide the Limestone beneath the upper and more recent layers of water-derived sediments and later Rocks.
Fieldtrip Planning
Measuring the Height of the Cliffs
Equipment Required:
* Ranging Poles
* Tape Measure
* Clinometer
The aim of this exercise is to find out whether the fault at Blue Anchor has a large enough downthrow to alter the limestone beds too much. The fault at Blue Anchor has blackish Rock on the left and red Rock on the right. This means that the Rock on either of the two sides has been downfaulted the whole height of the cliff. Therefore, the height of the cliff will give a minimum downthrow of the fault. This measurement maybe used to see whether the fault might be responsible for the loss of limestone around the Quantocks.
Collecting Mudstone to determine CaCO3
Equipment Required:
* Hammer
* Labels/Bags
* Goggles
Using the hammer and wearing the goggles, you take a reasonable sized sample of the mudstone and place the mudstone collected in the labelled bag. The data collected in the lab from the calcium carbonate content of the mudstone will give an indication as to whether the calcium carbonate has been precipitated out of the Rocks and has probably been dissolved in the water and dissolved into the mudstone.
Look at the ORS at the Quarry on the Quantocks
Equipment Required:
* Hard-hat
* Hand Lens
* Grain-Scale Cards
Wearing the hard-hat, I will be taking a selection of the ORS and looking at it under the hand lens. The ORS was formed in the Devonian and I will be looking for evidence that the depositional conditions were not suitable for the deposition of the Carboniferous Limestone. The size and shape of the individual grains can be used to see what the conditions were like then and therefore it might be possible to check for the depositional conditions in the Carboniferous.
General Equipment Used for Collecting Other Data
Equipment Required:
* Notebook
* Pencil
* Map
* Camera
Using the pencil, a fieldsketch is done of the various sites visited as a visual record of the fieldtrip. The map will be used to get a grid reference of the site, which will help show where the site is and help to identify the site on a map of the area and the site may help to prove one of the predictions right or wrong.
Lab Work Planning
The lab work was done on the Red Mudstone that will be collected on the fieldtrip to Blue Anchor Beach. The Mudstone will go through a chemical test to find out if the Limestone has been dissolved in the seawater in the sea, and has been precipitated out into the Mudstone Mudstones. If there is a significant percentage of CaCO3 in the Mudstone, it is possible to suggest that the limestone maybe in the Mudstones at Blue Anchor. The lab work will involve taking a known amount of the Mudstone and adding Hydrochloric Acid to it, which reacts and the loss in weight is the CO2 given off and therefore, the CaCO3 as well because the Acid will only react with the Limestone, so CO2 is CaCO3 as well. A percentage amount of about 30% will probably mean that there is a lot of Limestone in the Mudstone that would not be there normally.
Possible Errors and Limitations
1. There maybe no evidence at all will be found. The Limestone could be deep underground with no erosion that has happened. This means that there will be no evidence at all that the Limestone was ever deposited. To counteract this possible limitation, I will be looking at areas where there is known areas of Limestone present in the underlying Rocks. I will also be following the path of the Carboniferous Limestone to possibly find Carboniferous fossils and therefore prove that the Limestone was deposited.
2. There is a lot of faulting along the North Somerset Coast, and this may interrupt the reading for the estimated downthrow of the major fault that is on Blue Anchor Beach. There are other faults along the Beach. From the largest of these faults on Blue Anchor Beach, I am hoping to calculate a downthrow of the fault, which will give an estimation that if the Limestone has been buried under the present surface, then it will give a minimum depth that the Limestone is underneath the surface Rock. There is no way to solve this problem although since the fault we are measuring is the largest of the faults, and therefore with the largest downthrow, the other faults wont affect the Rocks as much as the bigger of the faults.
Health and Safety Issues
Fieldtrip Hazards
1. Getting in and out of the minibus and crossing the road. Avoiding the low ceilings is a good idea otherwise; your head may experience pain. To overcome this problem, be careful when getting in and out remembering to bow your head. Alternatively, wear your hard-hat, as you need it for the cliff work anyway. Walk across the road and do not cross in stupid places, such as before a car or on a blind bend.
2. Slippery sea wall. When walking down to the sea via the slipway, it may be very wet where the tide was last in. This may cause you to slip over and so it is best to walk down the slope, wear walking boots for extra grip, and watch out for each other.
3. When working near the cliffs or on the Rocks, there may be a hazard of a Rock falling on your head or you tripping on a wet or unstable Rock. To minimise the effects of these problems, wear a hard-hat and walking boots for extra grip. To avoid Rocks, walk on the sand, and if that is not possible, avoid Rocks with seaweed, moss or other greenery on them as these are generally the most wet and the most unsuitable to stand on.
4. The Sea could potentially be a major hazard when working nears the shoreline. Tidal currents in the Bristol Channel area are some of the strongest in the UK. This means that extra care is required when we are measuring the pebbles that are on the beach near the sea, as the sea can come in very quickly and someone may be swept out to sea. However, with care, this is unlikely to happen.
5. Falling off the sea wall is a potential hazard when accessing the beach. Care needs to be taken when walking down the slipway and to keep away from the edge. Falling off the wall may cause bruising and you could twist your ankle.
Lab Work Hazards
1. The Hydrochloric Acid that will be used in the experiment to try and extract the calcium carbonate that could be in the Mudstone. The Acid is quite strong, two parts acid to 1 part water (in chemistry, this is known as a 2 Molar solution). This acid can cause skin irritation, and, if splashed into the eyes or other outside organs, can cause permanent damage and in the case of the eyes, can cause partial blindness. To minimise the risks posed by the Acid, goggles will be worn and labcoats to prevent the damage caused by splashing. In addition, the acid will be poured very carefully to minimise the risk of splashing.
2. The Carbon Dioxide that is produced in the experiment can be poisonous at high concentrations in a small area such as in the laboratory where this experiment will be carried out. To minimise the risks posed by the large volume of Carbon Dioxide that could potentially be extracted during the experiment, the experiment will be done in a well-ventilated room with the doors and windows open and in a fume cupboard, which is used for extracting noxious, fumes. The experiment will be left alone so there will be a few people near it who are doing there own lot of research into this subject.
The Fieldtrip
The fieldtrip day was planned in advance due to the tide times. We wanted a day where the tide was out at about midday and came in after we had left so we could access the beach. Our lecturer provided a set of tide times, from which we decided on Monday 2nd February as the tide was a very little tide and peaked in Early Morning and Late afternoon, ideal for what we wanted. In the fieldtrip, we went to the following place for the following reasons as well.
* West Quantoxhead. This is where the old quarry was. It gave evidence of a past river channel and there was two different textures of the sandstone. There was a coarser one and a finer one indicating either two periods of deposition or two different fluvial environment.
* Blue Anchor. We went here to collect the Mudstone for the Lab work. We also were looking for roundness of pebbles as a sign of erosion, if there were any Carboniferous Limestone pebbles on the beach and looking at the large fault present in the cliffs.
* Cannington Park Quarry. This is where one of the few outcrops of Carboniferous Limestone are visible. We were there looking for evidence of increased human activity and evidence of the Carboniferous Limestone deposition in other areas.
In the planning of the fieldtrip, I mentioned about what equipment to take on the fieldtrip in order to get the required measurements and data required to prove or disprove the hypotheses that I made at the beginning of this piece of coursework. The fieldtrip was split into several parts. Each part will have an aim, method, results and conclusion. There will be an evaluation of the method that was used at the end of the coursework as each method has almost the same hazards such as the sea, cliffs and slippery Rocks.
Measuring the Height of the Cliffs
The aim of this exercise is to find out whether the fault at Blue Anchor has a large enough downthrow to alter the limestone beds too much.
Equipment Required
* Ranging Poles
* Tape Measure
* Clinometer
The diagram in Appendix A shows how to setup this method. The ranging poles are set a certain distance apart pointing towards the cliff face and the measurement upto the cliff from a known height on the two ranging poles. The angles that are given by the compass-Clinometer can be used in the equation:
Where a is the first angle on the ranging pole, B is the second, d is the distance between the ranging poles, H is the height of the cliff and h is the height on the ranging poles.
The results for the height of the cliff were as follows.
Letter
Value
27
40
d
19.00m
h
1.35m
H
33.57m
The conclusion for this set of results, show that the fault has a downthrow of 33.57m and therefore, the minimum amount the Limestone could have been faulted below the present ground surface. The contours on maps of the area will help me to prove that this is sufficient for the Limestone to vanish. On my fieldsketch of the site, I estimated the height of the cliff to be 23m so 33.57m is quite close to my estimate. With the
Collecting Mudstone to determine CaCO3
The aim of this part was to collect mudstone, which will be used in the lab work and the results of which will give an indication as to whether the calcium carbonate has been precipitated out of the Rocks or hasn’t.
Equipment Required
* Hammer
* Labels/Bags
* Goggles
Using the hammer and wearing the goggles, you take a reasonable sized sample of the mudstone and place the mudstone collected in the labelled bag.
The results was a large piece about 20cm x 10cm x 5cm in size, and dark red in colour meaning that it probably contains a lot of water as well. This part is not very practical as most of it is going to be done in the lab work the week after the fieldtrip.
Look at the Old Red Sandstone at the Quarry on the Quantocks
The aim of this part was to look at the Old Red Sandstone that was formed in the Devonian and I looked for evidence that the depositional conditions were not suitable for the deposition of the Carboniferous Limestone.
Equipment Required
* Hard-hat
* Hand Lens
* Grain-Scale Cards
Wearing the hard-hat, I will be taking a selection of the Old Red Sandstone and looking at it under the hand lens. The size and shape of the individual grains can be used to see what the conditions were like in the Devonian and this can be compared with known conditions and this can be used to predict whether the conditions in the carboniferous were any different to what the books say was the general pattern.
The results for this part of the fieldtrip were quite interesting. In the Quarry, an old river channel was flowing during the Devonian period when the Rock was deposited. It has now been infilled by later Permo-Triassic Rocks. There are no carboniferous Rocks in the Quarry on the Quantocks. This will be explained later on. I collected two sand samples, one from the earlier sample and one from the later one. The earlier one had larger grains, and the other one had smaller grains.
General Equipment Used for Collecting Other Data
The aim of this part of the fieldtrip was to provide a graphical representation of the fieldwork. They will all be used to prove or disprove the hypotheses that I have collected no data for on the fieldtrip or during the desktop investigation.
Equipment Required
* Notebook
* Pencil
* Map
* Camera
Using the pencil, a fieldsketch is done of the various sites visited as a visual record of the fieldtrip. The map will be used to get a grid reference of the site, which will help show where the site is and help to identify the site on a map of the area and the site may help to prove one of the predictions right or wrong. The camera will be used for taking photos of the methods used to help with the method writing up. It will also be used to make a more accurate fieldsketch than the one I was able to draw on site which will be shown in Appendix A.
The results for this part can be seen at various points in this project but this data will mostly be found in the Appendixes as additional information.
Rock Measurements
This part of the fieldwork was to find and measure different components of the Rocks, the size and shape of the Rocks, and the average content of Limestone pebbles on the Beach at Blue Anchor.
Equipment Required
* Callipers
* Ruler
* Quadrat
* Prepared Sheet of Measurements of Rock Axis
* Prepared Sheet of Quadrat Measurements
For the Rock sizes, I will be using the three axis of the Rock; length, width, depth, and this will be measured using the callipers and the ruler. They will be recorded on the prepared sheet. The A-axis is usually the longest axis, then the B-axis is the next longest, followed by the C-axis which is the shortest axis.
For the Quadrat measurements, I will be creating co-ordinates within a 10-metre area by generating random numbers using a calculator. This will give me some random sets of numbers. I will be recording the size of the Rock, type of Rock, proportion of minerals, and relative ages of the Rocks.
The results for this piece of the fieldtrip are in Appendix B but like with all the results mentioned in this section and the lab work, it will be properly explained and interpreted in the conclusion at the end of the Lab Work.
Lab Work
Introduction
The Lab Work was to try to find out how much calcium carbonate content there was in the Triassic Mudstone that was found in abundance at Blue Anchor Beach. With the sample collected for this piece of lab work taken during the fieldtrip, and the experiment being a week after the fieldtrip, the rock should be quite fresh although none of the calcium carbonate should have disappeared because there was no acid in the bag or any other reactant.
The aim for the lab work was to find out if the Limestone had been deposited in the carboniferous period but had had a period of erosional and weathering processes. This would have caused the newly eroded Limestone to move into watercourses where it underwent more erosion. After that period, it arrived at the sea. Once in contact with the sea, some of the calcium carbonate would have dissolved into the sea, which is already full of calcium carbonate. Millions of years later, the calcium carbonate could have come out of solution and found its way into the Triassic rocks in the shape of the Mudstones. The Mudstones will naturally contain some calcium carbonate, which they got from the diurnal tide coming in and out. Therefore, this lab work is looking for more calcium carbonate than there should normally be in a bit of rock that has not been touched by the sea. A bit that has not been touched by the sea contains about 20% natural calcium carbonate. This information was found on the Internet (http://www.bgs.ac.uk) because, due to safety reasons, we were unable to access the foot of the cliffs due to rockfalls. Therefore, anything significantly higher than 20% calcium carbonate, may lead me to conclude that the Limestone was deposited and has been eroded, transported, and deposited in the later Triassic Mudstones.
Method
Rock Sample
1. Grind approximately 5g of the rock sample into a powder using a pestle and mortar.
2. Weigh a 250 cm3 conical flask.
3. Weigh the rock sample into the flask.
4. Accurately weigh approx. 150 cm3 of 2.5 molar hydrochloric acid into a beaker.
5. Add the hydrochloric acid to the flask with the rock sample, in a fume cupboard.
6. Once the reaction has finished (approx. 20 min.), weigh the flask plus reactants.
Control
The same method was used as the above, but instead of the rock sample, I added pure calcium carbonate. This was from the Chemistry Technicians at College. This was to test how accurate the method was, because the answer to the percent calcium carbonate should be 100% but we will have to see what percentage this method gives as the pure calcium carbonate content.
Calcium carbonate content
The percentage of calcium carbonate in the rock sample is calculated from the weight of carbon dioxide given off.
One molecule of carbon dioxide is given off for each molecule of calcium carbonate.
The relative molecular mass of carbon dioxide is 44 grams per mole, and that of calcium carbonate is 100 grams per mole.
Therefore, for every 44 grams of carbon dioxide given off, we must have had 100 grams of calcium carbonate originally.
Sample weight = (3)
CO2 weight = (2) + (3) + (4) - (6)
CaCO3 weight = CO2 weight x (100 / 44)
% CaCO3 = (CaCO3 weight / sample weight) x 100
Results
Rock Sample- Before
Weight of Flask = 92.18g
Weight of Rock Sample = 5.05g
Total Weight = 97.23g
Weight of Beaker = 104.57g
Weight of Acid = 154.45g
Total Weight = 259.02g
Total Weight in Fume Cupboard = (92.18 + 5.05 + 154.45) = 251.68g
Rock Sample- After
Weight of Flask = 250.18g
Weight lost = (251.68 – 250.18) = 1.5g
CaCO3 = (1.5 * (100/44)) = 3.409g
% CaCO3 = ((3.409/5.05) * 100) = 35.0611% CaCO3
Control- Before
Weight of Flask = 94.93g
Weight of Sample = 4.10g
Total Weight = 99.03g
Weight of Beaker = 82.71g
Weight of Acid = 164.01g
Total Weight = 246.72g
Total Weight in Fume Cupboard = (94.93 + 4.10 + 164.01) = 263.04g
CaCO3 Sample- After
Weight of Flask = 260.84g
Weight lost = (263.04 – 260.84) = 2.20g
CaCO3 = (2.2 * (100/44) = 5g
% CaCO3 = ((5/4.10) * 100) =121.95% CaCO3
Conclusion
Looking at the results for the Rock sample, I can see that the Mudstone contained 35%. This is much higher than the 20% that is supposedly in a bit of Mudstone untouched by the sea. This means that there might have been some erosion of the Limestone for abnormal amount to be found within the Mudstones.
Looking at the result for the control of this investigation, I can see that there is either something wrong with my measurements or there is something wrong with the calculations or the actual procedure. The reason that there is something wrong is that the calculations came up with a value of 122% which is not possible because
a) 100% is everything. You can't have more than everything can.
b) Pure CaCO3 is 100%, so more is not pure CaCO3, but this is not possible.
The method is quite accurate but there are some things that are not accurate enough with it. This is due to the results for the pure calcium carbonate. The errors that were discovered in this method are found in the Evaluation section of this investigation.
Hypotheses Proved/Disproved
There were six possibilities about where the Carboniferous Limestone has gone in Somerset. These were as follows:
* No limestone deposited at all.
* Limestone deposited then eroded to nothing.
* Limestone deposited and then folded and faulted below the surface.
* Limestone has been overlaid by other Rocks.
* Human Activities have removed all the Limestone.
* Combination of the above.
In this section, I will be studying the evidence that I have collected from the desktop investigation, fieldwork and the lab work and trying to disprove or prove each hypothesis depending on the evidence that is available to me at the time.
No Limestone Deposited At All
This hypothesis was to be proved/disproved by the desktop investigation into the conditions that were around at the time. The desktop search was aimed at finding out whether the conditions for deposition was correct for the Carboniferous Limestone or whether there was a period where there was limited conditions for the deposition. The depositional information that was gathered and that is shown in Appendix B shows that the depositional conditions are correct in the Devonian and the Permo-Triassic periods. This can be backed up by the information in the Permian Rocks because they contain some Carboniferous Fossils, so there was a Carboniferous influence in the area but could there possibly be no rocks?
* This part of the puzzle is answered by the presence of some of the Carboniferous Limestone at Cannington Quarry. During the Fieldtrip, we went to look at Cannington Park Quarry. This quarry is disused and was inaccessible due to the fencing because of the large, deep lake that had filled in the quarry floor. However, this proves that there was some deposition of some Carboniferous Limestone although according to just this hypothesis, not all over Somerset but in a confined area. There is a fieldsketch of the disused quarry in Appendix A at the end of this project.
* In addition, other information that was gathered from the disused quarry at West Quantoxhead showed that there was some Carboniferous activity present so there must have been a Carboniferous period in this area because some Carboniferous fossils were found at the quarry as well.
Limestone deposited then eroded to nothing.
This hypothesis was going to test if there had been a period of the deposition of the Carboniferous Limestone but it had been subsequently uplifted during the Variscan Orogeny (which formed the Quantocks) and then there was a period of erosion where the Carboniferous Limestone had been eroded to nothing or very little because of the Cannington Park outcrop. This would be proved by the fieldtrip to Blue Anchor Beach. To prove this hypothesis, there were two things that we did to try to prove or disprove this hypothesis. These were as follows:
1. To bring some Triassic/Jurassic Mudstone back for the lab experiment that was carried out after the fieldtrip. If the limestone had been eroded, then it is possible that the limestone could have been transported in one of the river or streams that existed at the time, and it was transported to the sea. At the sea, the limestone would have been easily dissolved in the seawater due to the relatively high pH. Over a period of about 60 million years, the calcium carbonate would be carried in suspension until it was taken out of solution probably by a change in the salinity or the pH of the seawater. The calcium carbonate is then taken into the sediments that were forming the Triassic Mudstone and therefore, if there is a large enough quantity of calcium carbonate in the Mudstone, it probably means that the limestone was eroded and deposited in the Mudstone.
* This information is backed up by the fact that there is about 35% calcium carbonate in the Mudstone. This result was taken from the lab work and it was worked out using chemical equations. However, I also did a control of pure calcium carbonate and this came out as a result of 121%, which is not possible. This means there is something wrong with the method or the maths afterwards. However, this may still be accurate because something could have contaminated the pure calcium carbonate. A normal Triassic Mudstone above the shoreline untouched by the sea which would have added calcium carbonate to it naturally, so a sample was taken and 20% was discovered to be the percentage content of the calcium carbonate. Therefore, the 35% probably means there has been another source of the calcium carbonate into the Triassic Mudstone, and this was probably the result, from this information, that the limestone was eroded and, after a period of transportation and solution, was deposited in the later Triassic rocks.
2. The second way to try to prove or disprove the second hypothesis, focused on the pebbles on the Beach at Blue Anchor. Two different experiments were carried out on the fieldtrip. These were as follows:
* The first experiment was to compare the rocks found at Budleigh Salterton with the rocks that were found on Blue Anchor Beach. Twenty rocks from both of the localities were measured and they were recorded in a table. A Zingg diagram was drawn of the b/c and a/b axis for both of the sets of results. This graph will show what shape the rocks are generally at this location. The aim of this piece of work was to find out if the pebbles on the Beach were more rounded than the ones at Budleigh Salterton. The Zingg diagrams which are in Appendix B. The comparison of the shape of the rocks using A, B and C Axis to determine the relative shapes, to see if any of the rocks have been transported. The more rounded or the shorter the A-Axis but the longer the B and C axes the rocks are, the more transportation there has been. If the limestone had been rounded, I would expect to see that the Beach Pebbles are more rounded and the Budleigh Salterton less so.
* This method found that using the Zingg diagrams, the rocks at Budleigh Salterton were more rounded than the ones at Blue Anchor Beach. This probably means that the rocks at Blue Anchor Beach, using this information, had not been transported as they are and deposited as they are. This is true because the Quadrat results found that there was very few calcium carbonate or Carboniferous Limestone pebbles on Blue Anchor Beach. This is also backed up by the use of Krumbein’s Sphericity Index found in the table above the Zingg diagrams. This method is used for measuring the roundness of the pebbles at the locality. This index is found by an average of the values and the b/a and c/b values as well. The value for the Blue Anchor Beach is 1.34 compared to the 1.47 at Budleigh Salterton. This means that at Budleigh Salterton, there is again more evidence that the rocks that are found on the beach are the result of dissolving the calcium carbonate and not direct movement of the pebbles from the Quantocks to the Beach where they remained untouched by the sea for 100 million years.
* The second method that was used to determine if there was any Carboniferous Limestone on the Beach at Blue Anchor was using a quadrat. The quadrat was placed on the ground and co-ordinates were made before the fieldtrip departed, and information regarding the size of the Rock, type of Rock, proportion of minerals, and relative ages of the Rocks. At Blue Anchor Beach, there was little or no Carboniferous Limestone present in the quadrat areas that was examined. This means that the rocks did not just come down the streams and rivers and be deposited on the Beach. It means that the rocks were dissolved by the seawater and then after a period of about 30 million years of being dissolved in seawater, the conditions changed and the calcium carbonate came out of solution. It was mixed up in the sediments that was, at the time, going to form the red Triassic Mudstone which is now on the top at Kilve Beach. Therefore, due to the high levels of calcium carbonate found in the Mudstone during the lab experiment and the fact that there was no Carboniferous Limestone that was visible on the Beach, had to draw me to the conclusion that the rocks were not just eroded, transported, then deposited on the Beach but there was a period of solution in the seawater as well.
Limestone deposited and then folded and faulted below the surface.
The evidence for this hypothesis came from two places:
1. The first was the desktop investigation. The information that was collected was the folding seen by the dip of the rocks on a geological map of the area. The faulting that was found all along the North Coast of Somerset was also found using books and the Internet as points of reference. This information was gathered and it was looked. For the Quantocks to be a range of hills, there obviously is some folding present along the coast at Blue Anchor Beach. This means that some of the limestone probably is underneath the cliffs but at much greater depth where the limestone has been overlaid by other rocks. In my previous bit of coursework, I studied the Kilve Beach area. This area is very close to the area that is being looked at in this investigation as well. There is information regarding the dip of the rocks at Kilve. At Kilve, there are alternating layers of shale and limestone. This means, as the limestone is present all along the coast, which the limestone is present at Blue Anchor Beach but there is lots of rock on top of the limestone. There was an average dip of the limestone at Kilve of 23o and this means, by looking at a cross-section of the area, that the limestone has been dipped well below the Blue Anchor Beach area. All this information means that there is evidence that the limestone is underneath the rocks but because of subsequent periods of deposition, there is some overlying rock on top of the limestone.
2. The second piece of information just sort of backs up the previous bits of information gathered from the previous investigation and other sources of information that was used during the desktop investigation. During the fieldtrip, we made an estimate-using trigonometry the height of the cliff. This was because there was the largest fault along the coast in Somerset. This means that the displacement of the rocks would be the greatest because this fault has the largest amount of downthrow. The reason that this fault is so important to this investigation is because, the fault has Grey Marl and Gypsum beds at the same levels as the later beds of the Red Mudstone and this means that there has been a displacement of the fault of at least the height of the cliff so that the Red Mudstone can conformably lie on top of the Grey Marl and Gypsum Beds. Using the calculation that is shown in the results of the fieldtrip section I calculated the height of the cliff to be 33.57m, which means that without the dip of the rocks, the limestone could be a minimum of 33.57m below the present level of the Beach. There is a dip of 45o to the North East, which means that the angle of the fault is also 45o. This means that the limestone could be at least 30 metres below the surface of the Beach.
Limestone has been overlaid by other Rocks.
The evidence for this hypothesis is really the previous information as well. Because, since the evidence from Blue Anchor Beach and the books regarding the faulting, there must be some other rocks on top of the limestone because the limestone is not visible at the surface. In hypothesis 2, which was that the limestone had been eroded to nothing, this is highly unlikely. This is because not every part of the limestone could have been eroded in the same conditions because there is still an outcrop of the Carboniferous Limestone at Cannington. Therefore, because of the evidence that there was some deposition of the limestone in the Cannington area and not in other areas, has to draw me to the conclusion that there was Carboniferous Limestone deposited, not just in Cannington so there must be some rocks overlying the limestone. The limestone has probably been overlaid by Permian and Triassic/Jurassic sediments as well as some from the Cretaceous period. Since there was no evidence that there was no deposition of the Carboniferous Limestone, there must be some of this hypothesis present but in how much and of what composition, there is still debate among scientists today.
Human Activities have removed all the Limestone.
The evidence for this came from the Internet, maps and books on the subject of Quarrying. Additional information was also gathered from the old Quarry working at West Quantoxhead. The information gathered from the Internet and the books was to look for information regarding vast area of quarries that would need to be present for this much limestone to disappear. This was backed up by information from the maps regarding the visible scars of signs of quarrying. There are a few scattered quarries present in Somerset, which were not mining for sand and gravel, coal or other minerals and rocks. This is not sufficient to remove all the limestone that is probably present underneath the rocks.
The information that was gathered from the West Quantoxhead Quarry backs up the suggestion that quarrying in the Somerset area was not extensive enough to remove all the limestone from the area. Therefore, I think I can safely disprove this hypothesis due to insufficient quarries present.
Combination of the Above
Of all the hypotheses, which I suggested, this one was always going to be right. There is some evidence for all of the hypotheses made but there was insufficient to say that they were the only things to remove all of the limestone. Except the first hypothesis, regarding the fact that there was no deposition at all (Which can disproved by the fact that Carboniferous Limestone outcrops along the Coast at Kilve and at Cannington) all of the other hypotheses has had some influence in the disappearance of the Carboniferous Limestone from the Somerset area. The bit of information and the fieldtrip data that was collected contains bits of information questioning the reliability of the results. In addition, since there is information about all of the hypotheses, this means that there has to be a connection and the connection is that they were all involved in the disappearance of the Carboniferous Limestone.
Conclusion
I will make reference to two certain places in Somerset, which for me, have decided that none of the hypotheses on there own could have caused this much Carboniferous Limestone to disappear. These two places are:
* Cannington. This is the place, which proves that the Carboniferous Limestone is deposited. It outcrops here because of the increased amount of erosion that happened around it. This means it was exposed at the surface and has not had a chance to be eroded. This proves that the Carboniferous Limestone was deposited, the conditions were right and not all of the Carboniferous Limestone could have been eroded and deposited on the Beaches.
* Kilve. In my previous investigation, I was looking at the Oil Shale at Kilve Beach. The reason that this investigation is quite important to this investigation that the limestone that is at Kilve is Carboniferous Limestone, so this proves that the Carboniferous Limestone had been deposited as well. However, at Kilve there is another clue. The limestone at Kilve is dipping inland at about 23o and this means that the limestone is below the Quantocks but is buried deep underground.
* To prove that the limestone has been folded and faulted below the surface, the dip of the limestone at Kilve proves that the limestone dips into the Quantocks, which explains why no limestone is visible. This is because the limestone is too deep within the Quantocks for the Quarrying or the erosional processes to get at it.
* Before the Quantocks were uplifted during the Variscan Orogeny, the limestone had been laid down conformably on top of the ORS (Old Red Sandstone). When the Quantocks were first eroded, there was a period of erosion and some of the limestone made its way down the rivers and streams that existed in the Carboniferous and was found later on in the Triassic Mudstones. This accounts for the high percentage of calcium carbonate in the Mudstone.
* The reason that the Carboniferous Limestone outcrops at Cannington has become clearer because of the dip of the rocks. The rocks at Cannington are on the edge of the Quantocks so the uplift was much less. This also means that there was less erosion than on the top. This means that the deposition of the newer sediments and rocks on top of the Carboniferous Limestone had been less because there was rivers or streams that carried sediments to the lower levels. There was more deposition of these sediments on the top of the Quantocks.
* The sprinkling of the Carboniferous Limestone quarries that are present on the Quantocks proves where the limestone is within economically viable reach of the surface. This means than in these areas, either there has been more erosion to expose the limestone or there has been less deposition. This depends on the nature and the Carboniferous topography that was resent in the area of the Quarry.
* The combination of these factors and the information that was gathered from the desktop, laboratory and the fieldtrip has lead me to conclude that a combination of factors was responsible for the lack of visible Carboniferous Limestone in Somerset.
Evaluation
Errors and Solutions next time in the Collection of the Data
The Desktop investigation had some things, which made looking for the correct information very hard. This was because some of the information published in the different books was not the same. This can be illustrated by the information that was gathered on the depositional history of the area. One book said that the Quantocks had some Carboniferous Limestone in them but only in certain areas of the Quantocks. In other words, the Carboniferous Limestone was not very well spread out all over the Quantocks. The other book said that the entire of the Quantocks was covered in Carboniferous Limestone but had been buried deep within the Quantocks because of subsequent periods of erosion and deposition of new sediments.
The Lab Work Method has some things that could be better to make the accuracy and the reliability better. These are as follows:
* In the experiment that I used, it assumes that the only thing that will react with the Hydrochloric Acid is the calcium carbonate in the Mudstone. There maybe other things in the Mudstone which will react with the acid and therefore may give an unfair representation of the amount of calcium carbonate in the Mudstone. If there are other reactants, the results that the Mudstone may have given may lead me to assume that the Limestone had been eroded away and was now found in the Mudstones. This may not be the case, but if there are other things, then the assumption is incorrect.
* The experiment was carried out using a small sample of the Mudstone that was collected on the Beach at Blue Anchor. There maybe an unfair proportions either one way or the other, which the sample may have contained significantly more or less than an average sample. This, like the above limitation, may have lead to unfair assumptions being made to do with the location of the Carboniferous Limestone that may be present now.
* The experiment was to find out how much calcium carbonate was in the Mudstone. However, the Mudstone was on the Beach within the tidal range. This means that there was a regular influx of seawater twice a day. This, of course, would have added natural calcium carbonate to the Rock. In this experiment, we will be looking for adverse levels of the calcium carbonate in the Rock.
To make the lab work more reliable and accurate and try to minimise the limitations of the method that were given above I would have done:
* To improve the limitation regarding other reactants that may have reacted with the acid, rather than just the calcium carbonate, which this experiment was concentrating on. To do this, I would have conducted another experiment to see if there were any other components in the Mudstone. This experiment would have involved different chemical tests that would have been necessary to the experiment for this to be carried out. However, this would mean that the lab work in this investigation will turn more into a chemistry investigation and this is not very important really because this experiment will only give a rough idea because everyone else’s sample of the Mudstone would have contained different amounts of calcium carbonate.
* To improve the limitation regarding a different or unfair amount of calcium carbonate within the sample, I will be looking at the other results that the other people doing this investigation got and made a prediction that what I got as a percentage calcium carbonate, most of the group got about the same amount. There were a couple of odd results but most of them did follow the general pattern that emerged of about 30% calcium carbonate.
* The final limitation that was found with the lab work was to do with the natural calcium carbonate that would have been present in the Mudstone. There is very little way of finding out what the actual content from the possible erosion of the Limestone and not naturally occurring. To counteract this problem, I would need to find a different sample of the Rock, but from the cliff way above the high-tide line. I would have assumed that the sample had not been touched by the sea and therefore, any calcium carbonate found in the Rock has come solely possibly from the Limestone that had been eroded.
Improvements and Add-ons to this Investigation
To make improvements to this investigation in the future, I would need to carry more extensive research into the internal geology of the Quantock Hills. This would help to understand where the limestone has gone. To gather more background information than what was gathered in this investigation, I would have emailed a specialist in the subject and the British Geological Society as well so that they could give me additional information, which would have been useful in this investigation.
Acknowledgements
I wish to thank my Mum and Dad for proofreading my investigation.
In addition, I wish to thank Ros Smith, My Geology Teacher, who helped me with the geological issues that I found whilst doing this investigation.
I wish to thank Chris Marlow, the physics technician. Chris helped with the lab work to extract the calcium carbonate from the Mudstone and he drove the minibus to Blue Anchor so we could get the data.
Bibliography
http://www.somerset.gov.uk/minerals/
Edwards, D and King, C. GEOSCIENCE: Understanding Geological Processes. Open University and Keele University: Hodder & Stoughton, 1999.
Whittaker, A and Green, G W. Geology of the country around Weston-Super-Mare. Her Majesty’s Stationary Office: Crown Copyright, 1983.
McLeish, A. GEOLOGICAL SCIENCE. Nelson Publishers, 1992.
Prudden, H. Geology and Landscape of Taunton Deane.
Http://www.quakes.bgs.ac.uk/recbrit.html. Accessed 09/02/2004
Reduced Extract from Landranger 182, Weston-Super-Mare and Bridgwater. 1:50,000. (C) Crown Copyright and Ordinance Survey.
??
??
??
??
1
Graham Symonds